Palettes · Science
Scientific figures one dataset, three palettes, the code and the licences
A figure in a paper is printed in grey, read by people with color blindness, and redrawn by people who want your colors. Here one computed dataset is drawn three ways, by plotting code that was run, in palettes chosen by measurement, each with its licence from its source.
- Figures, as files
- 3
- Formats
- PDF · SVG · PNG
- Run with
- matplotlib 3.10.8
The figures
One dataset, three figures
The hours from sunrise to sunset, computed for each latitude and day, so anyone can redraw them. Switch the vision to see each figure as a reader with color blindness, or a grey printer, would.
Simulated with Machado, Oliveira and Fernandes (2009); grayscale keeps luminance only. The figures are in English, as most journals ask.
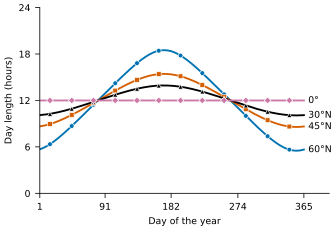
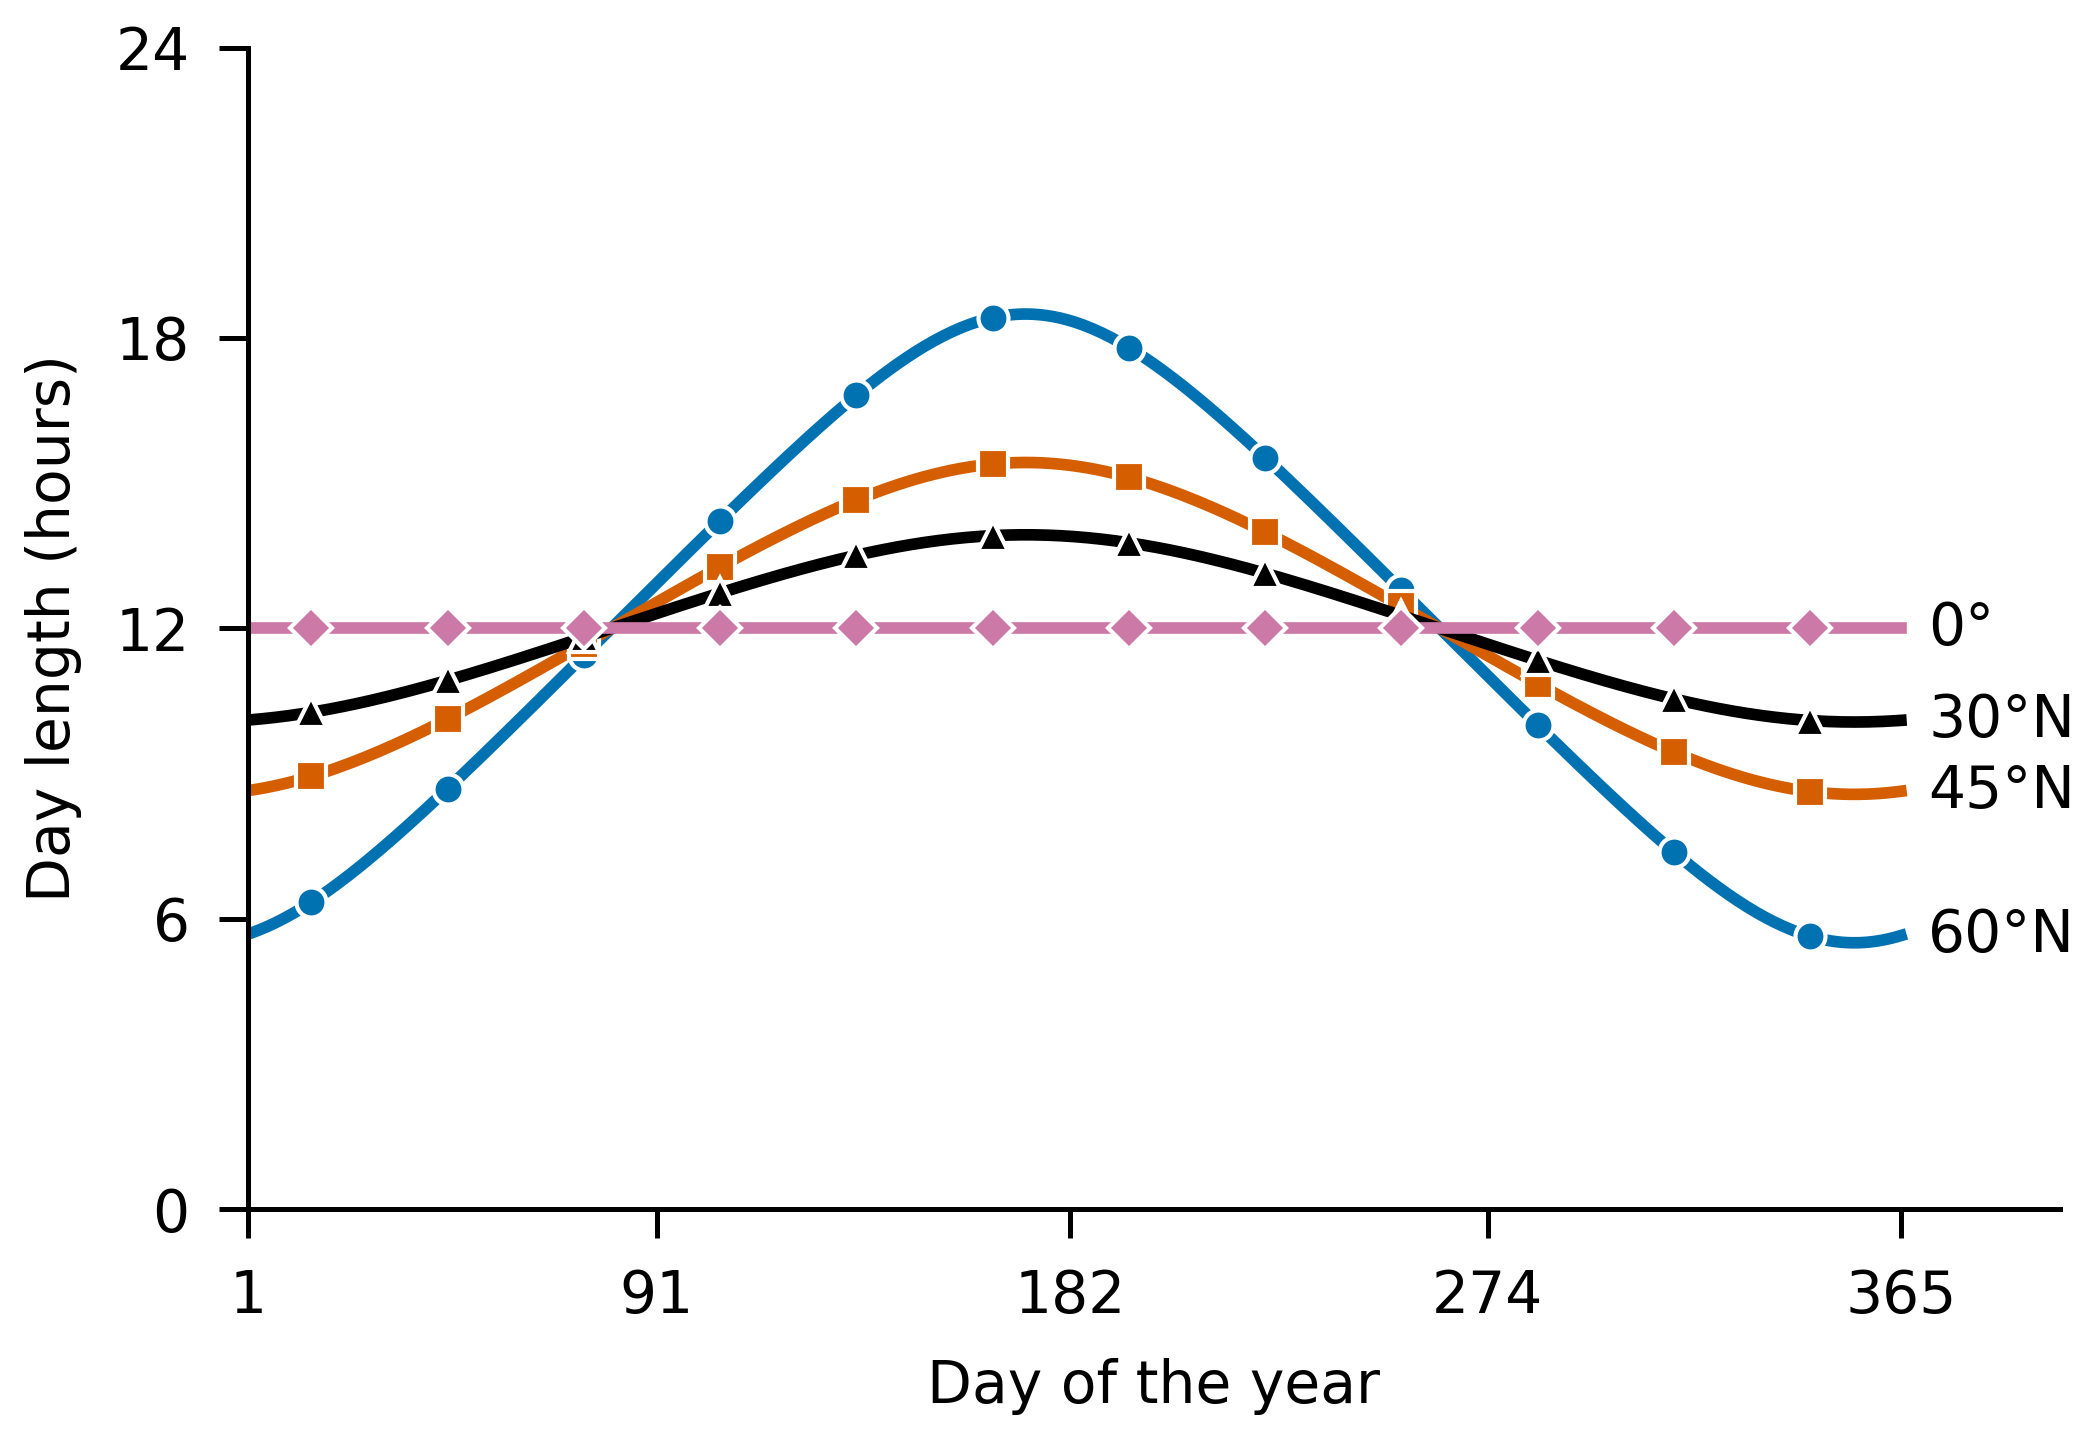
categorical · Okabe–Ito Day length through the year at four latitudes
Download PDF, 13 KBSVG, 34 KBPNG, 150 KB
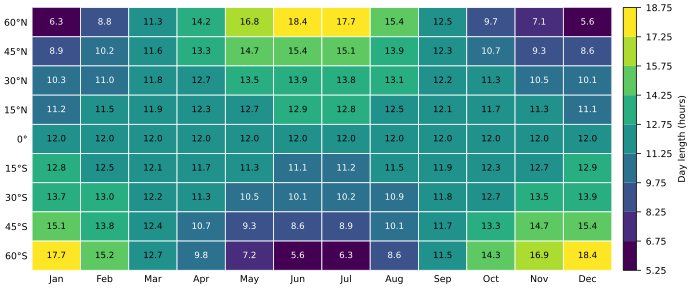
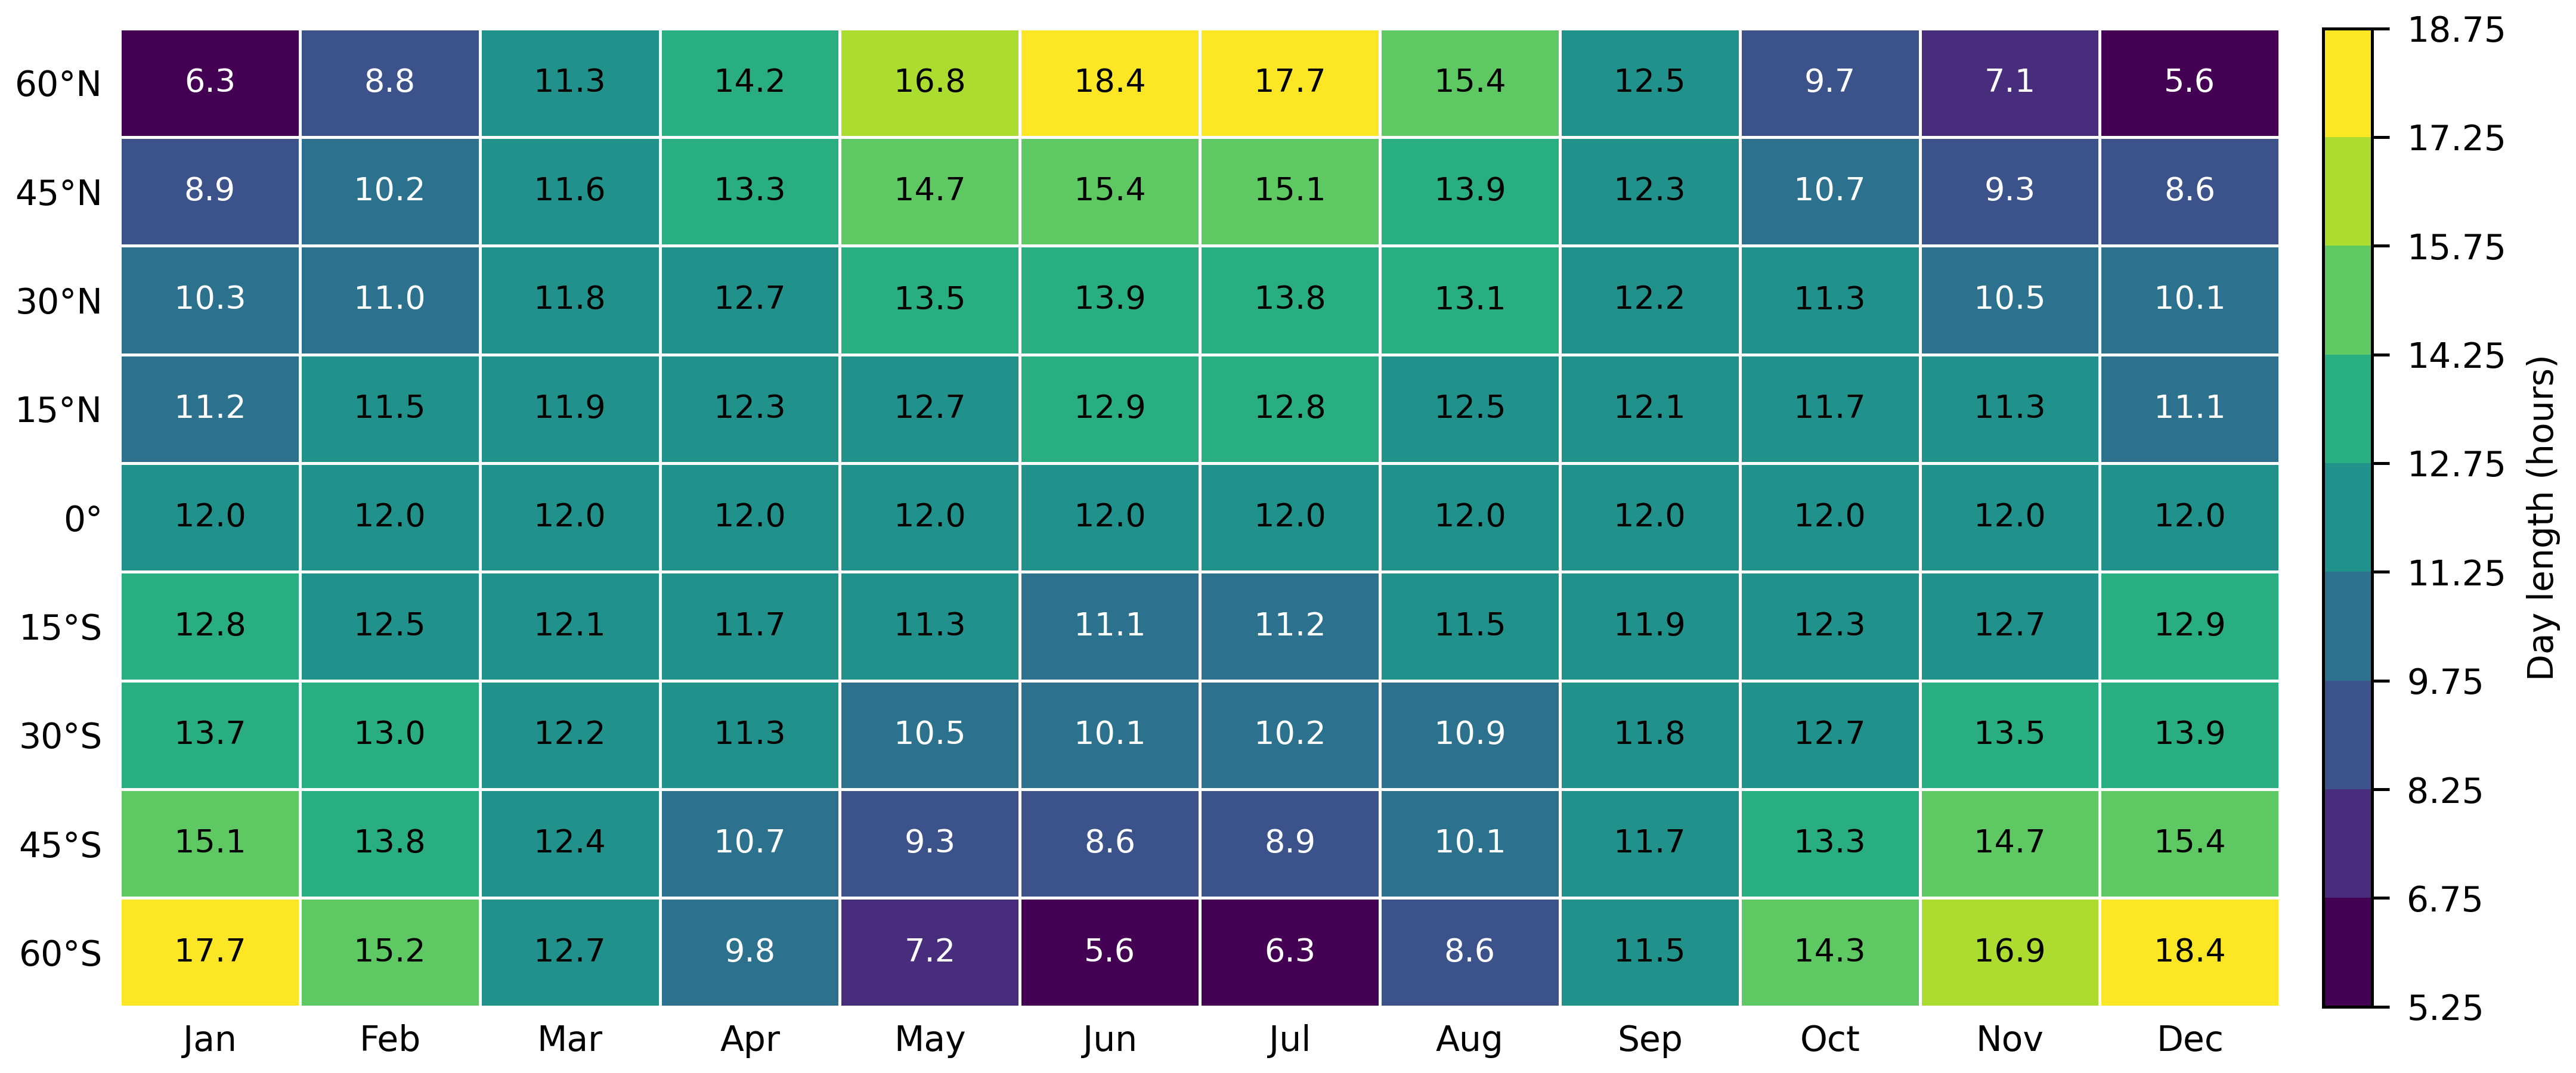
sequential · viridis Day length by latitude and month
Download PDF, 15 KBSVG, 101 KBPNG, 306 KB
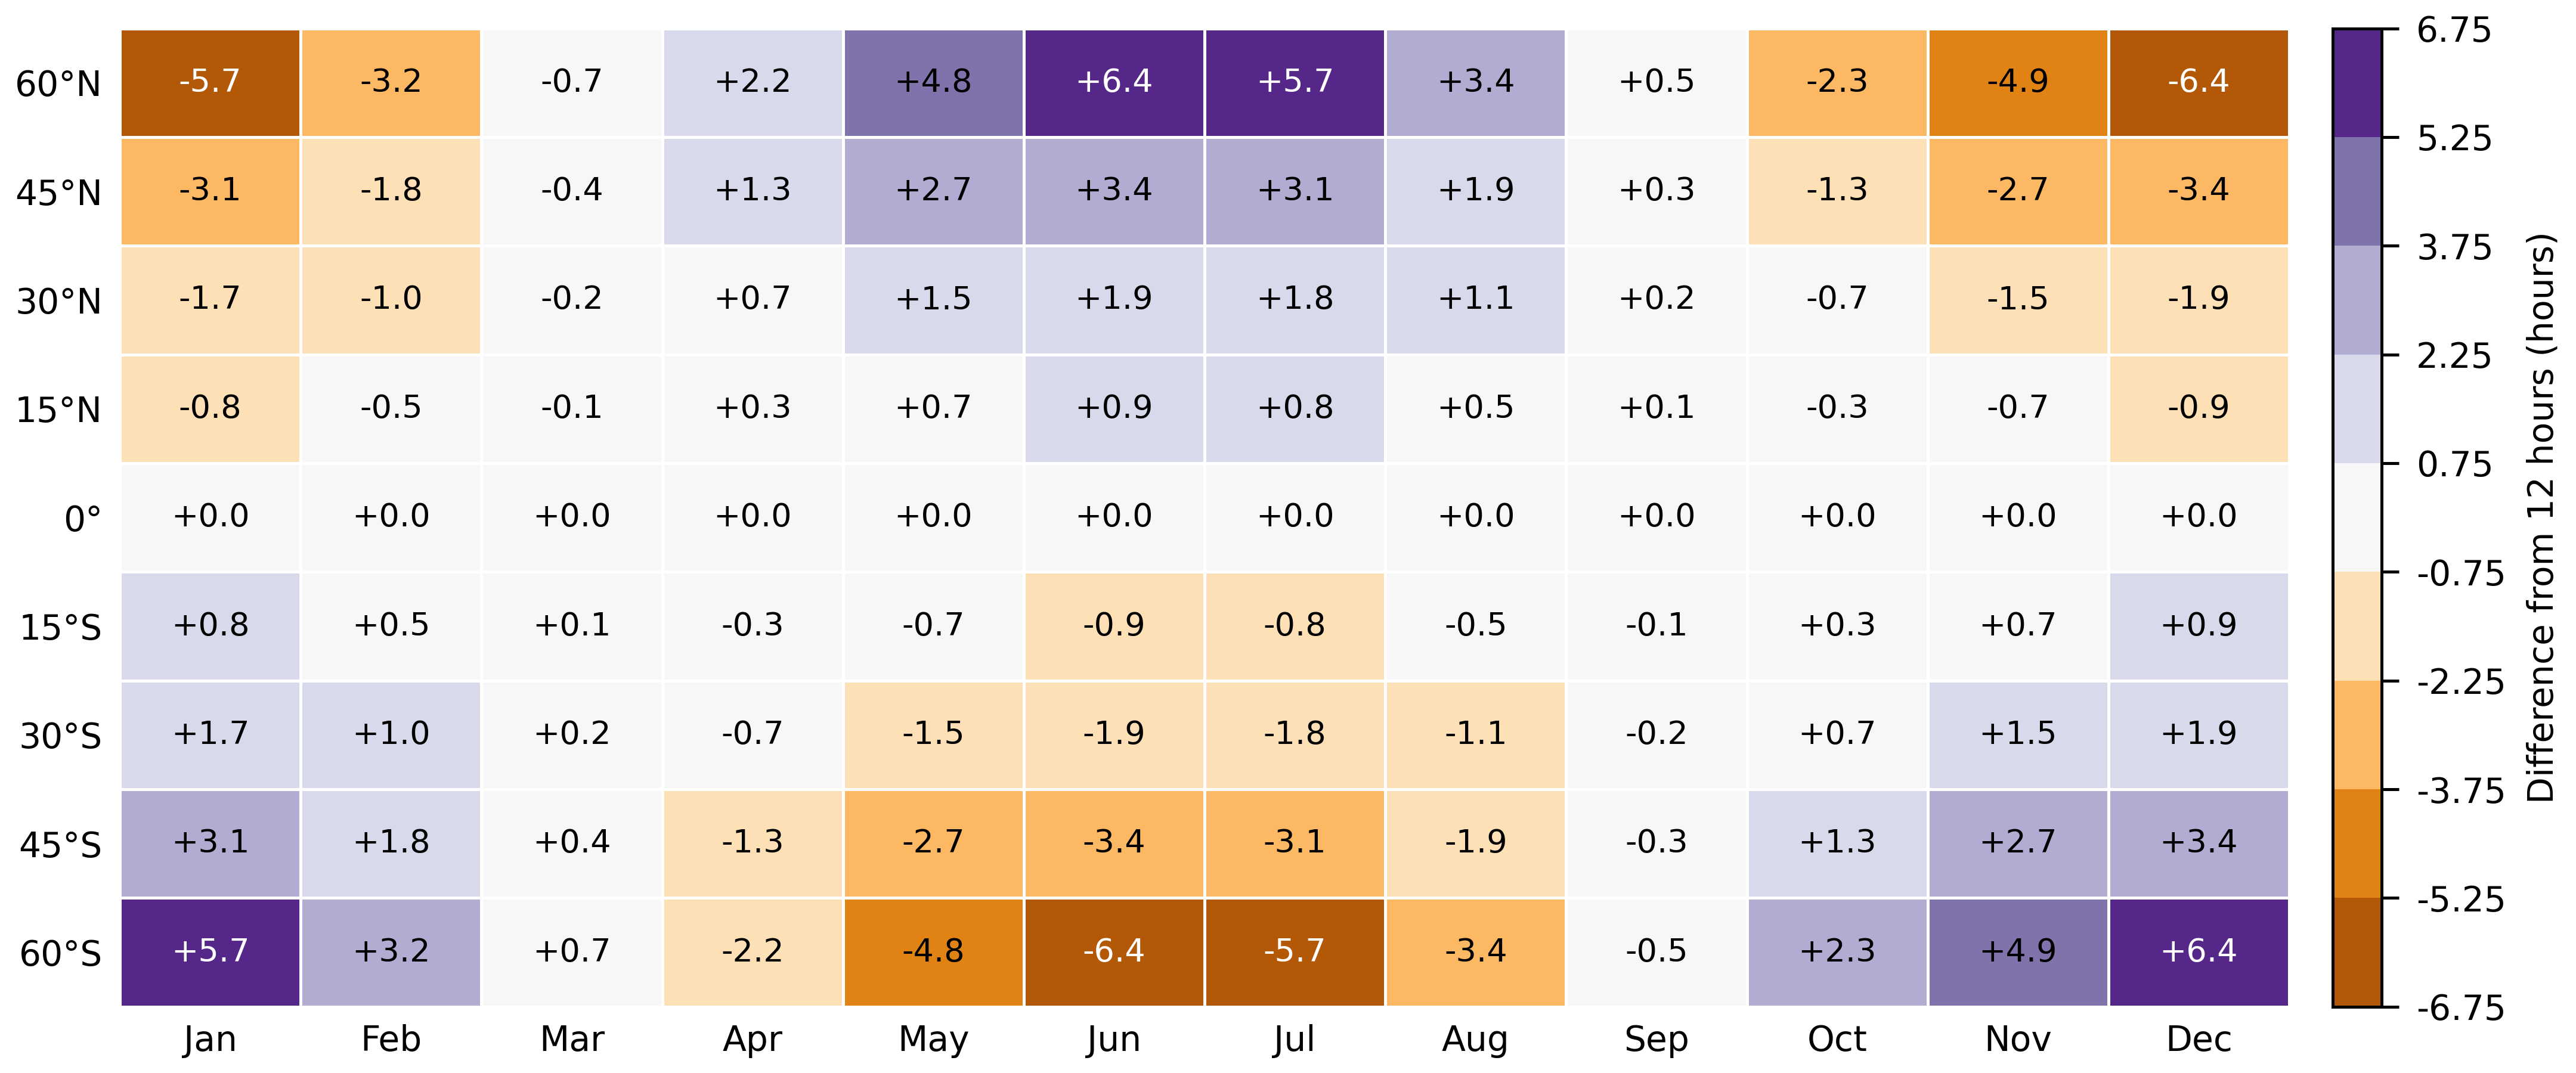
diverging · PuOr Difference from 12 hours
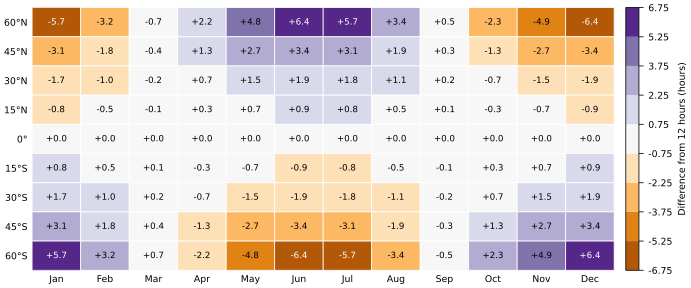
Download PDF, 16 KBSVG, 104 KBPNG, 317 KB
Measured
Why these palettes
Each figure’s palette, and what it was measured for. Distances are CIEDE2000 between simulated colors; lightness is OKLCH L.
| Palette | Job | What was checked | Result |
|---|---|---|---|
| Okabe–Ito, first four | Telling the lines apart | The closest pair in typical vision and three color-vision simulations; then in grayscale | ΔE 12.3 at worst (Blue and Reddish purple); ΔE 6.0 in grayscale, which is why each line also has a marker and a label |
| viridis | Magnitude, low to high | Lightness rises at every step, in color and in grayscale | Yes: L 0.285 to 0.918; the tightest step is ΔE 4.5 |
| cividis | Magnitude, made for color-vision deficiency | The same, as an alternative to viridis | Yes: L 0.259 to 0.921; the tightest step is ΔE 6.8 |
| PuOr | Above and below a middle that means something | Lightest in the middle; the two sides apart in every vision that sees hue | Yes: the closest mirrored pair is ΔE 20.1 |
Method
What makes a figure survive
Name the job first. Categories get distinct hues; a magnitude gets one direction of lightness; a difference gets two hues meeting at a light middle, and only when the middle means something, as 12 hours does here.
Give every line a second cue. A marker shape and a label at the line’s end let the figure work in grey and without a legend to look up.
Use classes, and print the values when there is room. Nine classes of a fixed width can be read off the colorbar; a printed value cannot be misread at all.
Avoid rainbows. jet and RdYlGn change lightness unevenly or not at all, and draw edges the data does not have; the scales page measures both.
Label the colorbar with its quantity and unit, and give each figure a caption that names the palette.
The code
The code that drew them
One Python file, matplotlib and NumPy only. It writes each figure as PDF with its fonts embedded, as SVG with the text drawn as outlines so it looks the same wherever it opens, and as a 600 dpi PNG.
"""Three publication figures from one dataset, in color-blind-safe palettes.

From https://auricartisan.com/library/palette/scientific/ - CC0 1.0.

The data is computed, not measured: the hours from sunrise to sunset at the
centre of the sun, without refraction, from Cooper's (1969) solar declination.
So the figures can be rebuilt anywhere, and checked against the page.

    python figures.py          writes figure-1, figure-2 and figure-3
                               as .pdf, .svg and .png (600 dpi)
    python figures.py --grid   prints the 9 x 12 grid of hours as JSON

Needs matplotlib and NumPy.
"""
import json
import sys

import matplotlib
import numpy as np

matplotlib.use("Agg")
import matplotlib.pyplot as plt  # noqa: E402
from matplotlib.colors import BoundaryNorm, ListedColormap  # noqa: E402

# Okabe and Ito (2008), in the order that keeps the first n colors furthest
# apart in every color vision (see the chart palettes page). One marker each.
OKABE_ITO = ["#0072B2", "#D55E00", "#000000", "#CC79A7"]
MARKERS = ["o", "s", "^", "D"]
# viridis (van der Walt and Smith, CC0) and PuOr (ColorBrewer, Apache 2.0), nine stops each.
VIRIDIS = ["#440154", "#472D7B", "#3B528B", "#2C728E", "#21918C", "#28AE80", "#5EC962", "#ADDC30", "#FDE725"]
PUOR = ["#B35806", "#E08214", "#FDB863", "#FEE0B6", "#F7F7F7", "#D8DAEB", "#B2ABD2", "#8073AC", "#542788"]

LATITUDES = [60, 45, 30, 15, 0, -15, -30, -45, -60]
MONTHS = ["Jan", "Feb", "Mar", "Apr", "May", "Jun", "Jul", "Aug", "Sep", "Oct", "Nov", "Dec"]
DAYS = [15, 46, 74, 105, 135, 166, 196, 227, 258, 288, 319, 349]  # the 15th of each month
# Nine classes of 1.5 hours, centred on 12: the middle class is days about as long as nights.
EDGES = 12 + 1.5 * (np.arange(10) - 4.5)

INK = "#000000"
PAPER = "#FFFFFF"


def declination(day):
    """Solar declination in degrees: Cooper (1969)."""
    return 23.45 * np.sin(np.radians(360 * (284 + day) / 365))


def day_length(lat, day):
    """N = (2/15) arccos(-tan(latitude) tan(declination)), in hours."""
    x = -np.tan(np.radians(lat)) * np.tan(np.radians(declination(day)))
    return np.where(x <= -1, 24.0, np.where(x >= 1, 0.0, 2 * np.degrees(np.arccos(np.clip(x, -1, 1))) / 15))


def grid():
    return np.array([[float(day_length(lat, d)) for d in DAYS] for lat in LATITUDES])


def lat_label(lat):
    return "0°" if lat == 0 else f"{abs(lat)}°{'N' if lat > 0 else 'S'}"


def luminance(hex_color):
    c = np.array([int(hex_color[i:i + 2], 16) for i in (1, 3, 5)]) / 255
    c = np.where(c <= 0.04045, c / 12.92, ((c + 0.055) / 1.055) ** 2.4)
    return float(0.2126 * c[0] + 0.7152 * c[1] + 0.0722 * c[2])


def ink_on(hex_color):
    """Black or white, whichever has the higher WCAG contrast on the cell."""
    y = luminance(hex_color)
    return INK if (y + 0.05) / 0.05 >= 1.05 / (y + 0.05) else PAPER


def style():
    plt.rcParams.update({
        "font.family": "DejaVu Sans",
        "font.size": 7,
        "axes.spines.top": False,
        "axes.spines.right": False,
        "axes.linewidth": 0.6,
        "xtick.major.width": 0.6,
        "ytick.major.width": 0.6,
        "pdf.fonttype": 42,          # embed TrueType, as journals ask
        "svg.fonttype": "path",      # draw the SVG's text as outlines: it looks the same anywhere
        "svg.hashsalt": "auric-artisan",
    })


def figure_lines():
    """Categorical: day length through the year at four latitudes, labelled at the line ends."""
    fig, ax = plt.subplots(figsize=(3.5, 2.4), layout="constrained")
    days = np.arange(1, 366)
    for lat, color, marker in zip([60, 45, 30, 0], OKABE_ITO, MARKERS):
        hours = day_length(lat, days)
        ax.plot(days, hours, color=color, lw=1.4, marker=marker, markevery=(14, 30), ms=3.6,
                markeredgecolor=PAPER, markeredgewidth=0.5)
        ax.text(371, hours[-1], lat_label(lat), va="center", ha="left", color=INK)
    ax.set_xlim(1, 400)
    ax.set_ylim(0, 24)
    ax.set_xticks([1, 91, 182, 274, 365])
    ax.set_yticks([0, 6, 12, 18, 24])
    ax.set_xlabel("Day of the year")
    ax.set_ylabel("Day length (hours)")
    return fig


def figure_grid(values, colors, edges, label, fmt):
    """A latitude-by-month grid in nine classes, every value printed in its cell."""
    fig, ax = plt.subplots(figsize=(7.2, 3.0), layout="constrained")
    cmap = ListedColormap(colors)
    norm = BoundaryNorm(edges, cmap.N)
    mesh = ax.pcolormesh(values, cmap=cmap, norm=norm, edgecolors=PAPER, linewidth=0.6)
    for i, row in enumerate(values):
        for j, v in enumerate(row):
            cell = colors[int(np.clip(np.searchsorted(edges, v, side="right") - 1, 0, len(colors) - 1))]
            ax.text(j + 0.5, i + 0.5, fmt(v), ha="center", va="center", fontsize=6.5, color=ink_on(cell))
    ax.set_xticks(np.arange(12) + 0.5, MONTHS)
    ax.set_yticks(np.arange(9) + 0.5, [lat_label(lat) for lat in LATITUDES])
    ax.invert_yaxis()
    ax.tick_params(length=0)
    for side in ("left", "bottom"):
        ax.spines[side].set_visible(False)
    bar = fig.colorbar(mesh, ax=ax, ticks=edges, fraction=0.04, pad=0.02)
    bar.ax.set_yticklabels([f"{e:g}" for e in edges])
    bar.set_label(label)
    bar.outline.set_linewidth(0.6)
    return fig


def main():
    hours = grid()
    if "--grid" in sys.argv:
        print(json.dumps(hours.round(9).tolist()))
        return
    style()
    figures = {
        "figure-1": figure_lines(),
        "figure-2": figure_grid(hours, VIRIDIS, EDGES, "Day length (hours)", lambda v: f"{v:.1f}"),
        "figure-3": figure_grid(hours - 12, PUOR, EDGES - 12, "Difference from 12 hours (hours)", lambda v: f"{v:+.1f}"),
    }
    for name, fig in figures.items():
        fig.savefig(f"{name}.pdf", metadata={"CreationDate": None})
        fig.savefig(f"{name}.svg", metadata={"Date": None})
        fig.savefig(f"{name}.png", dpi=600)
        plt.close(fig)
        print(name)


if __name__ == "__main__":
    main()
pip install matplotlib numpy
python figures.py
How it was run
Run on 15 October 2026 with matplotlib 3.10.8 and NumPy 2.4.6, on Python 3.14.2 under Pyodide 314.0.7. Its grid of hours matched the site’s model at all 108 cells; its SVGs use the palettes’ colors and no others; every printed value reads at 4.86:1 or more on its cell.
Licences
What each palette lets you do
As each source states it. Where a source states no licence, so does this table.
| Palette | From | Licence | What it asks |
|---|---|---|---|
| Okabe–Ito | Masataka Okabe and Kei Ito, Color Universal Design (2002, revised 2008) | None stated for the palette | The authors ask that use of their teaching files mention Masataka Okabe and Kei Ito. Cite their page. |
| viridis | Stéfan van der Walt and Nathaniel Smith (2015), in matplotlib | CC0 1.0 | Nothing. |
| cividis | Jamie Nuñez, Christopher Anderton and Ryan Renslow (2018), PLOS ONE | CC0, as published with the article | Nothing. |
| PuOr | ColorBrewer: Cynthia Brewer, Mark Harrower and The Pennsylvania State University (2002) | Apache License 2.0 | If you redistribute the scheme’s values, the licence’s conditions apply, including keeping its notice. |
| These figures and figures.py | Auric Artisan | CC0 1.0 | Nothing. |
Criteria
WCAG criteria it helps with
Found a mistake? Write to us and we will correct it.