Accessibility pattern · Media
Complex image
A chart needs two alternatives: a short one that names it and says what it shows, and a long one that holds the detail. Here the short alt is on the chart, aria-describedby ties it to the data table beside it, and a details element holds the description in words for everyone.
- WCAG criteria
- 5
- Keyboard rules
- 2
- Checked with
- axe, keyboard and the inspector
Live demo
Try it
Use it with a mouse, a keyboard or a screen reader. The inspector beside it shows what the browser tells assistive technology as you go: focus, state changes and announcements.
Shaded: June to September, when over 95% of the year's rain falls.
| Month | Rainfall (mm) |
|---|---|
| January | 0.2 |
| February | 0.2 |
| March | 0.1 |
| April | 0.1 |
| May | 7.3 |
| June | 526.3 |
| July | 919.9 |
| August | 560.8 |
| September | 383.5 |
| October | 91.3 |
| November | 11.0 |
| December | 1.6 |
| Year | 2,502.3 |
Describe this image
A bar chart of average rainfall for each month of the year, in millimetres, measured at Santacruz in Mumbai.
From January to April the bars barely leave the axis, under 1 mm a month, and May brings 7 mm. Then the monsoon arrives: 526 mm in June, a peak of 920 mm in July, 561 mm in August and 384 mm in September.
October falls back to 91 mm, November to 11 mm and December to 2 mm. Of the year's 2,502 mm, over 95% falls from June to September, and July alone brings more than a third.
The demo works without JavaScript only as far as its HTML does; the inspector needs JavaScript.
Keyboard
Keys it answers to
Every action works without a pointer.
| Key | What it does |
|---|---|
| Tab | Moves to Describe this image. The chart is not a tab stop, because nothing in it can be operated. |
| Enter or Space | Opens or closes the long description. |
Screen readers
What it announces
Written from the roles, names and states in the markup.
| When | Expected announcement |
|---|---|
| Reading reaches the figure | Mumbai's rain comes in four months. Average monthly rainfall at Santacruz, 1991 to 2020. Source: India Meteorological Department., figure |
| Reading reaches the chart | Bar chart of Mumbai's average monthly rainfall: over 95% falls from June to September, peaking at 920 mm in July., image. Average rainfall by month, in millimetres. Month, Rainfall (mm), January, 0.2… |
| The screen reader supports aria-details | … image, has details (a key moves to the description) |
| Focus reaches the disclosure | Describe this image, button, collapsed |
| Enter opens it | Expanded |
| Reading reaches the table | Average rainfall by month, in millimetres, table, 2 columns, 14 rows |
These are expected announcements, not recordings. Wording and order differ between screen readers and browsers.
Code
Copy the code
The exact files this demo runs on. The styles are served with a prefix that keeps this site's own styles out of the demo; what you copy is the original.
<div class="ap-cimg" data-ap-complex-image>
  <figure class="ap-cimg__fig">
    <figcaption class="ap-cimg__cap">
      <strong class="ap-cimg__point">Mumbai's rain comes in four months</strong>
      <span class="ap-cimg__source">Average monthly rainfall at Santacruz, 1991 to 2020. Source: India Meteorological Department.</span>
    </figcaption>

    <div class="ap-cimg__body">
      <div class="ap-cimg__chartbox">
        <svg class="ap-cimg__chart" viewBox="0 0 480 330" role="img" aria-label="Bar chart of Mumbai's average monthly rainfall: over 95% falls from June to September, peaking at 920 mm in July." aria-describedby="cimg-table" aria-details="cimg-long">
          <rect class="ap-cimg__band" x="234.33" y="44" width="134.67" height="246" rx="6"/>
          <text class="ap-cimg__unit" x="58" y="30" text-anchor="end">mm</text>
        <line class="ap-cimg__grid" x1="66" x2="470" y1="290" y2="290"/>
        <text class="ap-cimg__tick" x="58" y="295" text-anchor="end">0</text>
        <line class="ap-cimg__grid" x1="66" x2="470" y1="231.5" y2="231.5"/>
        <text class="ap-cimg__tick" x="58" y="236.5" text-anchor="end">250</text>
        <line class="ap-cimg__grid" x1="66" x2="470" y1="173" y2="173"/>
        <text class="ap-cimg__tick" x="58" y="178" text-anchor="end">500</text>
        <line class="ap-cimg__grid" x1="66" x2="470" y1="114.5" y2="114.5"/>
        <text class="ap-cimg__tick" x="58" y="119.5" text-anchor="end">750</text>
        <line class="ap-cimg__grid" x1="66" x2="470" y1="56" y2="56"/>
        <text class="ap-cimg__tick" x="58" y="61" text-anchor="end">1,000</text>
          <line class="ap-cimg__axis" x1="66" x2="470" y1="290" y2="290"/>
        <g class="ap-cimg__month" data-m="0">
          <rect class="ap-cimg__bar" x="71.83" y="288.5" width="22" height="1.5" rx="3"/>
          <text class="ap-cimg__label" x="82.83" y="316" text-anchor="middle">Jan</text>
          <text class="ap-cimg__label ap-cimg__label--short" x="82.83" y="318" text-anchor="middle">J</text>
        </g>
        <g class="ap-cimg__month" data-m="1">
          <rect class="ap-cimg__bar" x="105.5" y="288.5" width="22" height="1.5" rx="3"/>
          <text class="ap-cimg__label" x="116.5" y="316" text-anchor="middle">Feb</text>
          <text class="ap-cimg__label ap-cimg__label--short" x="116.5" y="318" text-anchor="middle">F</text>
        </g>
        <g class="ap-cimg__month" data-m="2">
          <rect class="ap-cimg__bar" x="139.17" y="288.5" width="22" height="1.5" rx="3"/>
          <text class="ap-cimg__label" x="150.17" y="316" text-anchor="middle">Mar</text>
          <text class="ap-cimg__label ap-cimg__label--short" x="150.17" y="318" text-anchor="middle">M</text>
        </g>
        <g class="ap-cimg__month" data-m="3">
          <rect class="ap-cimg__bar" x="172.83" y="288.5" width="22" height="1.5" rx="3"/>
          <text class="ap-cimg__label" x="183.83" y="316" text-anchor="middle">Apr</text>
          <text class="ap-cimg__label ap-cimg__label--short" x="183.83" y="318" text-anchor="middle">A</text>
        </g>
        <g class="ap-cimg__month" data-m="4">
          <rect class="ap-cimg__bar" x="206.5" y="288.3" width="22" height="1.7" rx="3"/>
          <text class="ap-cimg__label" x="217.5" y="316" text-anchor="middle">May</text>
          <text class="ap-cimg__label ap-cimg__label--short" x="217.5" y="318" text-anchor="middle">M</text>
        </g>
        <g class="ap-cimg__month" data-m="5">
          <rect class="ap-cimg__bar" x="240.17" y="166.8" width="22" height="123.2" rx="3"/>
          <text class="ap-cimg__label" x="251.17" y="316" text-anchor="middle">Jun</text>
          <text class="ap-cimg__label ap-cimg__label--short" x="251.17" y="318" text-anchor="middle">J</text>
        </g>
        <g class="ap-cimg__month" data-m="6">
          <rect class="ap-cimg__bar" x="273.83" y="74.7" width="22" height="215.3" rx="3"/>
          <text class="ap-cimg__label" x="284.83" y="316" text-anchor="middle">Jul</text>
          <text class="ap-cimg__label ap-cimg__label--short" x="284.83" y="318" text-anchor="middle">J</text>
        </g>
        <g class="ap-cimg__month" data-m="7">
          <rect class="ap-cimg__bar" x="307.5" y="158.8" width="22" height="131.2" rx="3"/>
          <text class="ap-cimg__label" x="318.5" y="316" text-anchor="middle">Aug</text>
          <text class="ap-cimg__label ap-cimg__label--short" x="318.5" y="318" text-anchor="middle">A</text>
        </g>
        <g class="ap-cimg__month" data-m="8">
          <rect class="ap-cimg__bar" x="341.17" y="200.3" width="22" height="89.7" rx="3"/>
          <text class="ap-cimg__label" x="352.17" y="316" text-anchor="middle">Sep</text>
          <text class="ap-cimg__label ap-cimg__label--short" x="352.17" y="318" text-anchor="middle">S</text>
        </g>
        <g class="ap-cimg__month" data-m="9">
          <rect class="ap-cimg__bar" x="374.83" y="268.6" width="22" height="21.4" rx="3"/>
          <text class="ap-cimg__label" x="385.83" y="316" text-anchor="middle">Oct</text>
          <text class="ap-cimg__label ap-cimg__label--short" x="385.83" y="318" text-anchor="middle">O</text>
        </g>
        <g class="ap-cimg__month" data-m="10">
          <rect class="ap-cimg__bar" x="408.5" y="287.4" width="22" height="2.6" rx="3"/>
          <text class="ap-cimg__label" x="419.5" y="316" text-anchor="middle">Nov</text>
          <text class="ap-cimg__label ap-cimg__label--short" x="419.5" y="318" text-anchor="middle">N</text>
        </g>
        <g class="ap-cimg__month" data-m="11">
          <rect class="ap-cimg__bar" x="442.17" y="288.5" width="22" height="1.5" rx="3"/>
          <text class="ap-cimg__label" x="453.17" y="316" text-anchor="middle">Dec</text>
          <text class="ap-cimg__label ap-cimg__label--short" x="453.17" y="318" text-anchor="middle">D</text>
        </g>
          <text class="ap-cimg__peak" x="284.83" y="66.7" text-anchor="middle">920</text>
        </svg>
        <p class="ap-cimg__key"><svg class="ap-cimg__swatch" viewBox="0 0 18 18" aria-hidden="true" focusable="false"><rect x=".5" y=".5" width="17" height="17" rx="4.5"/></svg><span><strong>Shaded: June to September,</strong> when over 95% of the year's rain falls.</span></p>
      </div>

      <table class="ap-cimg__table" id="cimg-table">
        <caption>Average rainfall by month, in millimetres</caption>
        <thead>
          <tr><th scope="col">Month</th><th scope="col">Rainfall (mm)</th></tr>
        </thead>
        <tbody>
          <tr data-m="0"><th scope="row">January</th><td>0.2</td></tr>
          <tr data-m="1"><th scope="row">February</th><td>0.2</td></tr>
          <tr data-m="2"><th scope="row">March</th><td>0.1</td></tr>
          <tr data-m="3"><th scope="row">April</th><td>0.1</td></tr>
          <tr data-m="4"><th scope="row">May</th><td>7.3</td></tr>
          <tr data-m="5"><th scope="row">June</th><td>526.3</td></tr>
          <tr data-m="6"><th scope="row">July</th><td>919.9</td></tr>
          <tr data-m="7"><th scope="row">August</th><td>560.8</td></tr>
          <tr data-m="8"><th scope="row">September</th><td>383.5</td></tr>
          <tr data-m="9"><th scope="row">October</th><td>91.3</td></tr>
          <tr data-m="10"><th scope="row">November</th><td>11.0</td></tr>
          <tr data-m="11"><th scope="row">December</th><td>1.6</td></tr>
        </tbody>
        <tfoot>
          <tr><th scope="row">Year</th><td>2,502.3</td></tr>
        </tfoot>
      </table>
    </div>

    <details class="ap-cimg__long" id="cimg-long">
      <summary class="ap-cimg__toggle">
        <svg class="ap-cimg__chev" viewBox="0 0 24 24" aria-hidden="true" focusable="false"><path d="m9 6 6 6-6 6"/></svg>
        Describe this image
      </summary>
      <div class="ap-cimg__words">
        <p>A bar chart of average rainfall for each month of the year, in millimetres, measured at Santacruz in Mumbai.</p>
        <p>From January to April the bars barely leave the axis, under 1 mm a month, and May brings 7 mm. Then the monsoon arrives: 526 mm in June, a peak of 920 mm in July, 561 mm in August and 384 mm in September.</p>
        <p>October falls back to 91 mm, November to 11 mm and December to 2 mm. Of the year's 2,502 mm, over 95% falls from June to September, and July alone brings more than a third.</p>
      </div>
    </details>
  </figure>
</div>
/* Complex image. Uses the --ap-* design tokens. */
.ap-cimg {
  container-type: inline-size;
  width: min(100%, 760px);
  margin-inline: auto;
  color: var(--ap-text);
  font-family: var(--ap-font);
}

.ap-cimg__fig {
  display: grid;
  gap: 18px;
  margin: 0;
  padding: 22px 24px 24px;
  border: 1px solid var(--ap-border);
  border-radius: var(--ap-radius-lg);
  background: var(--ap-surface);
  box-shadow: var(--ap-shadow-md);
}

.ap-cimg__cap {
  display: grid;
  gap: 4px;
}
.ap-cimg__point {
  font-size: 1.1875rem;
  font-weight: 650;
  line-height: 1.3;
}
.ap-cimg__source {
  color: var(--ap-text-3);
  font-size: .875rem;
  line-height: 1.5;
}

.ap-cimg__body {
  display: grid;
  grid-template-columns: minmax(0, 1fr);
  gap: 20px;
  align-items: start;
}
@container (min-width: 620px) {
  .ap-cimg__body { grid-template-columns: minmax(0, 1fr) 210px; }
  .ap-cimg__chartbox { align-self: center; }
}

/* The chart */
.ap-cimg__chart {
  display: block;
  width: 100%;
  height: auto;
  overflow: visible;
  font-family: var(--ap-font);
}
.ap-cimg__band { fill: var(--ap-accent-soft); }
.ap-cimg__grid {
  stroke: var(--ap-border);
  stroke-width: 1;
}
.ap-cimg__axis {
  stroke: var(--ap-border-strong);
  stroke-width: 1.5;
}
.ap-cimg__tick,
.ap-cimg__unit,
.ap-cimg__label {
  fill: var(--ap-text-3);
  font-size: 14px;
  font-variant-numeric: tabular-nums;
}
.ap-cimg__unit {
  font-size: 13px;
  font-weight: 600;
}
.ap-cimg__bar {
  fill: var(--ap-accent);
  transition: fill var(--ap-duration) var(--ap-ease);
}
.ap-cimg__peak {
  fill: var(--ap-accent-text);
  font-size: 14px;
  font-weight: 700;
  font-variant-numeric: tabular-nums;
}
.ap-cimg__label--short {
  display: none;
}

/* The key to the shaded band */
.ap-cimg__key {
  display: flex;
  align-items: flex-start;
  gap: 10px;
  margin: 12px 0 0;
  color: var(--ap-text-2);
  font-size: .875rem;
  line-height: 1.5;
}
.ap-cimg__key strong {
  color: var(--ap-text);
  font-weight: 650;
}
.ap-cimg__swatch {
  flex-shrink: 0;
  width: 18px;
  height: 18px;
  margin-top: 1px;
  fill: var(--ap-accent-soft);
  stroke: var(--ap-accent);
  stroke-width: 1;
}

/* On a narrow card the chart scales down, so its words scale up. */
@container (max-width: 480px) {
  .ap-cimg__tick,
  .ap-cimg__unit,
  .ap-cimg__peak,
  .ap-cimg__label { font-size: 21px; }
  .ap-cimg__label { display: none; }
  .ap-cimg__label--short { display: inline; }
}

/* One month lit in both the chart and the table */
.ap-cimg__month.is-lit .ap-cimg__bar { fill: var(--ap-accent-hover); }
.ap-cimg__month.is-lit .ap-cimg__label {
  fill: var(--ap-text);
  font-weight: 700;
}

/* The data table */
.ap-cimg__table {
  width: 100%;
  border-collapse: collapse;
  font-size: .875rem;
  font-variant-numeric: tabular-nums;
}
.ap-cimg__table caption {
  padding-bottom: 8px;
  color: var(--ap-text-2);
  font-size: .8125rem;
  font-weight: 600;
  line-height: 1.4;
  text-align: start;
}
.ap-cimg__table th,
.ap-cimg__table td {
  padding: 5px 8px;
  border-bottom: 1px solid var(--ap-border);
  text-align: start;
  line-height: 1.3;
}
.ap-cimg__table td {
  text-align: end;
}
.ap-cimg__table thead th {
  color: var(--ap-text-3);
  font-size: .75rem;
  font-weight: 700;
  letter-spacing: .04em;
  text-transform: uppercase;
}
.ap-cimg__table thead th:last-child {
  text-align: end;
}
.ap-cimg__table tbody th {
  font-weight: 500;
}
.ap-cimg__table tbody tr:nth-child(n+6):nth-child(-n+9) td {
  font-weight: 700;
}
.ap-cimg__table tfoot th,
.ap-cimg__table tfoot td {
  border-bottom: 0;
  border-top: 1.5px solid var(--ap-border-strong);
  font-weight: 700;
}
.ap-cimg__table tr.is-lit th,
.ap-cimg__table tr.is-lit td {
  background: var(--ap-accent-soft);
  color: var(--ap-accent-soft-text);
}

/* The long description */
.ap-cimg__long {
  border: 1px solid var(--ap-border);
  border-radius: var(--ap-radius);
  background: var(--ap-surface-2);
}
.ap-cimg__toggle {
  display: flex;
  align-items: center;
  gap: 8px;
  min-height: var(--ap-target);
  padding: 10px 14px;
  border-radius: calc(var(--ap-radius) - 1px);
  font-weight: 650;
  list-style: none;
  cursor: pointer;
}
.ap-cimg__toggle::-webkit-details-marker {
  display: none;
}
.ap-cimg__toggle:hover {
  background: var(--ap-surface-3);
}
.ap-cimg__toggle:focus-visible {
  outline: 2px solid var(--ap-focus);
  outline-offset: 2px;
}
.ap-cimg__chev {
  flex-shrink: 0;
  width: 18px;
  height: 18px;
  fill: none;
  stroke: currentColor;
  stroke-width: 2.25;
  stroke-linecap: round;
  stroke-linejoin: round;
  transition: transform var(--ap-duration) var(--ap-ease);
}
.ap-cimg__long[open] .ap-cimg__chev {
  transform: rotate(90deg);
}
.ap-cimg__words {
  display: grid;
  gap: 10px;
  padding: 2px 16px 16px 40px;
  color: var(--ap-text-2);
  line-height: 1.6;
}
.ap-cimg__words p {
  margin: 0;
}
.ap-cimg__long[open] .ap-cimg__words {
  animation: ap-cimg-in var(--ap-duration) var(--ap-ease);
}

@container (max-width: 420px) {
  .ap-cimg__fig { padding: 18px 16px 18px; }
  .ap-cimg__words { padding-left: 16px; }
}

@keyframes ap-cimg-in {
  from { opacity: 0; transform: translateY(-4px); }
}

@media (prefers-reduced-motion: reduce) {
  .ap-cimg__bar,
  .ap-cimg__chev { transition: none; }
  .ap-cimg__long[open] .ap-cimg__words { animation: none; }
}
/**
 * Complex image: a chart with a short alt, a long description in a details
 * element, and its data in a table that aria-describedby points at.
 *
 * Markup: [data-ap-complex-image] holding a figure with an svg[role=img]
 * whose month groups carry data-m, and a table whose rows carry the same
 * data-m. The details element needs no script; this only lights a month in
 * both the chart and the table while the pointer is over either, so sighted
 * readers can match a bar to its number.
 */

export function init(root) {
  const parts = (m) => root.querySelectorAll(`[data-m="${m}"]`);
  let lit = null;

  function light(m) {
    if (m === lit) return;
    if (lit != null) for (const el of parts(lit)) el.classList.remove("is-lit");
    lit = m;
    if (m != null) for (const el of parts(m)) el.classList.add("is-lit");
  }

  function onOver(event) {
    const hit = event.target.closest("[data-m]");
    light(hit && root.contains(hit) ? hit.dataset.m : null);
  }
  function onLeave() {
    light(null);
  }

  root.addEventListener("pointerover", onOver);
  root.addEventListener("pointerleave", onLeave);
  return () => {
    light(null);
    root.removeEventListener("pointerover", onOver);
    root.removeEventListener("pointerleave", onLeave);
  };
}

for (const root of document.querySelectorAll("[data-ap-complex-image]")) init(root);
/* Design tokens for the pattern components. Light by default, dark when the
   system asks for it; set data-theme="dark" on :root to force dark. */
:root {
    --ap-radius-sm: 8px;
    --ap-radius: 12px;
    --ap-radius-lg: 16px;
    --ap-radius-full: 999px;
    --ap-font: "Instrument Sans", ui-sans-serif, system-ui, -apple-system, "Segoe UI", Roboto, sans-serif;
    --ap-mono: "JetBrains Mono", ui-monospace, "Cascadia Mono", "SF Mono", Consolas, monospace;
    --ap-ease: cubic-bezier(.2, .8, .2, 1);
    --ap-duration: 180ms;
    --ap-target: 44px;
    --ap-bg: #F4F4F5;
    --ap-surface: #FFFFFF;
    --ap-surface-2: #F4F4F5;
    --ap-surface-3: #E4E4E7;
    --ap-border: #E4E4E7;
    --ap-border-strong: #76767F;
    --ap-text: #18181B;
    --ap-text-2: #3F3F46;
    --ap-text-3: #5E5E66;
    --ap-accent: #4F46E5;
    --ap-accent-hover: #4338CA;
    --ap-on-accent: #FFFFFF;
    --ap-accent-text: #4338CA;
    --ap-accent-soft: #EEF2FF;
    --ap-accent-soft-text: #3730A3;
    --ap-focus: #4F46E5;
    --ap-danger: #B91C1C;
    --ap-danger-soft: #FEF2F2;
    --ap-success: #15803D;
    --ap-success-soft: #F0FDF4;
    --ap-warning: #A15C07;
    --ap-warning-soft: #FEFCE8;
    --ap-info: #1D4ED8;
    --ap-info-soft: #EFF6FF;
    --ap-scrim: rgb(9 9 11 / .48);
    --ap-shadow-sm: 0 1px 2px rgb(9 9 11 / .06);
    --ap-shadow-md: 0 1px 2px rgb(9 9 11 / .05), 0 6px 16px -4px rgb(9 9 11 / .1);
    --ap-shadow-lg: 0 2px 6px rgb(9 9 11 / .06), 0 20px 40px -12px rgb(9 9 11 / .22);
    --ap-light-bg: #F4F4F5;
    --ap-light-surface: #FFFFFF;
    --ap-light-surface-2: #F4F4F5;
    --ap-light-surface-3: #E4E4E7;
    --ap-light-border: #E4E4E7;
    --ap-light-border-strong: #76767F;
    --ap-light-text: #18181B;
    --ap-light-text-2: #3F3F46;
    --ap-light-text-3: #5E5E66;
    --ap-light-accent: #4F46E5;
    --ap-light-accent-hover: #4338CA;
    --ap-light-on-accent: #FFFFFF;
    --ap-light-accent-text: #4338CA;
    --ap-light-accent-soft: #EEF2FF;
    --ap-light-accent-soft-text: #3730A3;
    --ap-light-focus: #4F46E5;
    --ap-light-danger: #B91C1C;
    --ap-light-danger-soft: #FEF2F2;
    --ap-light-success: #15803D;
    --ap-light-success-soft: #F0FDF4;
    --ap-light-warning: #A15C07;
    --ap-light-warning-soft: #FEFCE8;
    --ap-light-info: #1D4ED8;
    --ap-light-info-soft: #EFF6FF;
    --ap-light-scrim: rgb(9 9 11 / .48);
    --ap-light-shadow-sm: 0 1px 2px rgb(9 9 11 / .06);
    --ap-light-shadow-md: 0 1px 2px rgb(9 9 11 / .05), 0 6px 16px -4px rgb(9 9 11 / .1);
    --ap-light-shadow-lg: 0 2px 6px rgb(9 9 11 / .06), 0 20px 40px -12px rgb(9 9 11 / .22);
    --ap-dark-bg: #09090B;
    --ap-dark-surface: #18181B;
    --ap-dark-surface-2: #27272A;
    --ap-dark-surface-3: #3F3F46;
    --ap-dark-border: #2E2E33;
    --ap-dark-border-strong: #8E8E97;
    --ap-dark-text: #FAFAFA;
    --ap-dark-text-2: #D4D4D8;
    --ap-dark-text-3: #A1A1AA;
    --ap-dark-accent: #818CF8;
    --ap-dark-accent-hover: #A5B4FC;
    --ap-dark-on-accent: #0C0A1F;
    --ap-dark-accent-text: #A5B4FC;
    --ap-dark-accent-soft: #1E1B4B;
    --ap-dark-accent-soft-text: #C7D2FE;
    --ap-dark-focus: #A5B4FC;
    --ap-dark-danger: #F87171;
    --ap-dark-danger-soft: #2A1215;
    --ap-dark-success: #4ADE80;
    --ap-dark-success-soft: #0F2A1A;
    --ap-dark-warning: #FACC15;
    --ap-dark-warning-soft: #2A2410;
    --ap-dark-info: #60A5FA;
    --ap-dark-info-soft: #0F1D33;
    --ap-dark-scrim: rgb(0 0 0 / .62);
    --ap-dark-shadow-sm: 0 1px 2px rgb(0 0 0 / .4);
    --ap-dark-shadow-md: 0 1px 2px rgb(0 0 0 / .4), 0 8px 20px -6px rgb(0 0 0 / .5);
    --ap-dark-shadow-lg: 0 2px 8px rgb(0 0 0 / .45), 0 24px 48px -12px rgb(0 0 0 / .7);
}
@media (prefers-color-scheme: dark) {
  :root:not([data-theme="light"]) {
      --ap-bg: #09090B;
      --ap-surface: #18181B;
      --ap-surface-2: #27272A;
      --ap-surface-3: #3F3F46;
      --ap-border: #2E2E33;
      --ap-border-strong: #8E8E97;
      --ap-text: #FAFAFA;
      --ap-text-2: #D4D4D8;
      --ap-text-3: #A1A1AA;
      --ap-accent: #818CF8;
      --ap-accent-hover: #A5B4FC;
      --ap-on-accent: #0C0A1F;
      --ap-accent-text: #A5B4FC;
      --ap-accent-soft: #1E1B4B;
      --ap-accent-soft-text: #C7D2FE;
      --ap-focus: #A5B4FC;
      --ap-danger: #F87171;
      --ap-danger-soft: #2A1215;
      --ap-success: #4ADE80;
      --ap-success-soft: #0F2A1A;
      --ap-warning: #FACC15;
      --ap-warning-soft: #2A2410;
      --ap-info: #60A5FA;
      --ap-info-soft: #0F1D33;
      --ap-scrim: rgb(0 0 0 / .62);
      --ap-shadow-sm: 0 1px 2px rgb(0 0 0 / .4);
      --ap-shadow-md: 0 1px 2px rgb(0 0 0 / .4), 0 8px 20px -6px rgb(0 0 0 / .5);
      --ap-shadow-lg: 0 2px 8px rgb(0 0 0 / .45), 0 24px 48px -12px rgb(0 0 0 / .7);
  }
}
:root[data-theme="dark"] {
    --ap-bg: #09090B;
    --ap-surface: #18181B;
    --ap-surface-2: #27272A;
    --ap-surface-3: #3F3F46;
    --ap-border: #2E2E33;
    --ap-border-strong: #8E8E97;
    --ap-text: #FAFAFA;
    --ap-text-2: #D4D4D8;
    --ap-text-3: #A1A1AA;
    --ap-accent: #818CF8;
    --ap-accent-hover: #A5B4FC;
    --ap-on-accent: #0C0A1F;
    --ap-accent-text: #A5B4FC;
    --ap-accent-soft: #1E1B4B;
    --ap-accent-soft-text: #C7D2FE;
    --ap-focus: #A5B4FC;
    --ap-danger: #F87171;
    --ap-danger-soft: #2A1215;
    --ap-success: #4ADE80;
    --ap-success-soft: #0F2A1A;
    --ap-warning: #FACC15;
    --ap-warning-soft: #2A2410;
    --ap-info: #60A5FA;
    --ap-info-soft: #0F1D33;
    --ap-scrim: rgb(0 0 0 / .62);
    --ap-shadow-sm: 0 1px 2px rgb(0 0 0 / .4);
    --ap-shadow-md: 0 1px 2px rgb(0 0 0 / .4), 0 8px 20px -6px rgb(0 0 0 / .5);
    --ap-shadow-lg: 0 2px 8px rgb(0 0 0 / .45), 0 24px 48px -12px rgb(0 0 0 / .7);
}
WCAG 2.2
What it meets
The success criteria this pattern takes care of, and how.
-
1.1.1 Non-text Content
Level A
The chart has a short alternative that names it and gives its main point, and a long one in words and as data.
-
1.3.1 Info and Relationships
Level A
The figure is named by its caption, the table has a caption and header cells, and aria-describedby ties the chart to its data.
-
1.4.1 Use of Color
Level A
The monsoon months are marked by a shaded band with a written key, not by a change of bar color.
-
1.4.11 Non-text Contrast
Level AA
Each bar clears 3:1 against the card, and the axis line is drawn in the control edge color.
-
4.1.2 Name, Role, Value
Level A
Describe this image is a native summary, so it is a button that reports expanded or collapsed.
Usage
When to use it
Use it
- Charts, graphs, maps, diagrams and infographics whose information cannot fit in one sentence.
- Any picture that carries data people may want to read exactly, compare or copy.
Use something else
- A picture whose point fits in a sentence: an alt is enough, as in the image alternatives pattern.
- A chart people need to explore point by point: make the chart itself interactive, as in the bar chart pattern.
- Decoration made to look like a chart: hide it, and don't describe it.
Common failures
How it usually goes wrong
The whole description in the alt
A paragraph in alt is read as one unbroken run that cannot be skimmed, and sighted readers never see it. Keep alt short and put the detail on the page.
Relying on longdesc
longdesc is obsolete in HTML and browsers never offered a dependable way to reach it. A visible disclosure or a link next to the image works for everyone.
Data only in the picture
Numbers drawn into a chart cannot be read exactly, copied or translated. Put them in a real table as well.
A description only screen readers get
A visually hidden long description shuts out sighted people who find charts hard to read. Show it, or let anyone open it.
The key point carried by color
Highlighting the monsoon months in a different shade alone fails people who cannot tell the shades apart. Add a band, a label or a pattern.
Notes
Building it
- Write the short alt as "what it is: what it shows". The chart type helps people picture it; the main point is why it is there.
- aria-describedby reads its target as one flat run of words straight after the name. That suits a short table like this one; for a long one, point it at a summary sentence instead.
- aria-details points at structured content and leaves it in place: screen readers that support it say "has details" and let people go there, with headings and table structure intact. Support is still uneven, so use it alongside a visible way in.
- The longdesc attribute is obsolete in the HTML standard and was never dependably supported; a details element or a link beside the image replaces it.
- The chart is drawn as inline SVG with role="img", so its labels and shapes are hidden from screen readers, which get the alt and the table instead.
Sources: W3C WAI: Complex images · WAI-ARIA 1.2: aria-details · India Meteorological Department: Climatological normals
Checked with axe in light and dark themes, at desktop and phone widths, and by keyboard. Not yet tested with every screen reader and browser pair. Report a correction
Related
Patterns that go with it
-
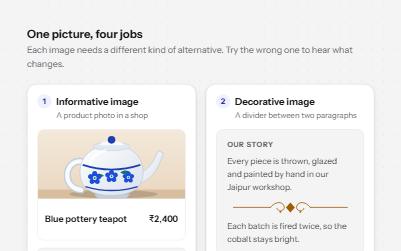
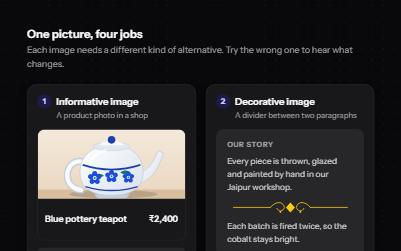
Image alternatives
Four kinds of image with the alt text each needs, what a screen reader says when it is wrong, and a decision tree.
-
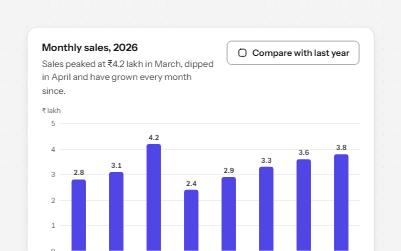
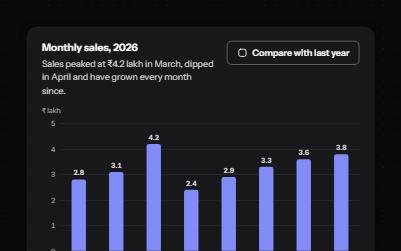
Accessible bar chart
A column chart people can read without seeing it: named bars on one tab stop, a tooltip that stays put, and a table.
-
Sortable table
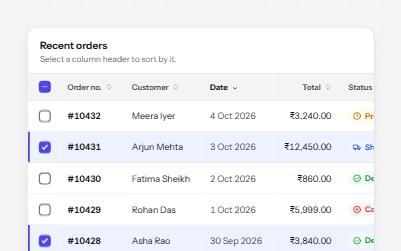
A data table with a caption, row headers, sort buttons that report the order, and row selection with a mixed Select all.
-
Show more
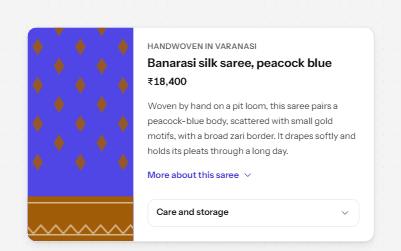
A button that reveals the rest of a long text in place, with the hidden part still reachable by find-in-page.