Accessibility pattern · Data display
Accessible line chart
The plot is a slider over the days: the arrow keys move a crosshair, the date is its value, and the numbers for that day follow in a polite announcement once you stop. Two series are told apart by a solid and a dashed line as well as a legend, the highest and lowest days are labelled on the chart, and the table it is drawn from is one button away.
- WCAG criteria
- 7
- Keyboard rules
- 6
- Checked with
- axe, keyboard and the inspector
Live demo
Try it
Use it with a mouse, a keyboard or a screen reader. The inspector beside it shows what the browser tells assistive technology as you go: focus, state changes and announcements.
Daily visitors, September 2026
The 7-day average rose 38% over the month, and visitors peaked at 2,640 on 24 September.
- Daily visitors
- 7-day average, dashed
Arrow keys move a day, Page Up and Page Down a week.
{visitors} visitors, 7-day average {average}Show data table
| Date | Visitors | 7-day average |
|---|---|---|
| 1,610 | 1,430 | |
| 1,630 | 1,440 | |
| 1,620 | 1,470 | |
| 1,650 | 1,490 | |
| 1,350 | 1,500 | |
| Lowest | 1,300 | 1,520 |
| 1,600 | 1,540 | |
| 1,680 | 1,550 | |
| 1,740 | 1,560 | |
| 1,760 | 1,580 | |
| 1,680 | 1,590 | |
| 1,450 | 1,600 | |
| 1,350 | 1,610 | |
| 1,800 | 1,640 | |
| 1,860 | 1,660 | |
| 1,770 | 1,670 | |
| 1,850 | 1,680 | |
| 1,930 | 1,720 | |
| 1,540 | 1,730 | |
| 1,460 | 1,740 | |
| 1,870 | 1,750 | |
| 1,990 | 1,770 | |
| 2,010 | 1,810 | |
| Highest | 2,640 | 1,920 |
| 1,950 | 1,920 | |
| 1,660 | 1,940 | |
| 1,510 | 1,950 | |
| 1,920 | 1,950 | |
| 2,010 | 1,960 | |
| 2,120 | 1,970 |
The 7-day average for 1 to 6 September includes the last days of August.
The demo works without JavaScript only as far as its HTML does; the inspector needs JavaScript.
Keyboard
Keys it answers to
Every action works without a pointer.
| Key | What it does |
|---|---|
| Tab | Moves onto the chart, showing the crosshair on the day it was last on; the next Tab moves to the table toggle. |
| Arrow Right or Arrow Left | Moves the crosshair to the next or previous day; Arrow Up and Arrow Down do the same. |
| Page Up or Page Down | Moves a week later or earlier, as Page Up raises a slider's value. |
| Home or End | Moves to 1 or 30 September. |
| Escape | Hides the crosshair and tooltip without moving focus; the next key brings them back. |
| Enter or Space | On Show data table, opens or closes the table. |
Screen readers
What it announces
Written from the roles, names and states in the markup.
| When | Expected announcement |
|---|---|
| Tab reaches the chart | Daily visitors, September 2026, slider, Tuesday, 1 September. Arrow keys move a day, Page Up and Page Down a week. |
| Arrow Right is pressed | Wednesday, 2 September |
| The keys stop for a moment | 1,630 visitors, 7-day average 1,440 |
| End is pressed, then Page Down | Wednesday, 23 September… 2,010 visitors, 7-day average 1,810 |
| The crosshair reaches 24 September | Thursday, 24 September… 2,640 visitors, 7-day average 1,920. Highest of the month |
These are expected announcements, not recordings. Wording and order differ between screen readers and browsers.
Code
Copy the code
The exact files this demo runs on. The styles are served with a prefix that keeps this site's own styles out of the demo; what you copy is the original.
<figure class="ap-line-chart" data-ap-line-chart data-max="3000" data-step="500" data-region="IN" aria-labelledby="line-chart-name">
<h3 class="ap-line-chart__name" id="line-chart-name">Daily visitors, September 2026</h3>
<p class="ap-line-chart__takeaway" id="line-chart-takeaway">The 7-day average rose 38% over the month, and visitors peaked at 2,640 on 24 September.</p>
<ul class="ap-line-chart__legend">
<li><svg class="ap-line-chart__key" viewBox="0 0 24 12" aria-hidden="true" focusable="false"><path d="M2 6h20"/></svg>Daily visitors</li>
<li><svg class="ap-line-chart__key ap-line-chart__key--avg" viewBox="0 0 24 12" aria-hidden="true" focusable="false"><path d="M2 6h20"/></svg>7-day average, dashed</li>
</ul>
<div class="ap-line-chart__chart" data-ap-chart>
<svg class="ap-line-chart__svg" aria-hidden="true" focusable="false">
<g data-ap-grid></g>
<path class="ap-line-chart__area" data-ap-area/>
<path class="ap-line-chart__line ap-line-chart__line--avg" data-ap-avg/>
<path class="ap-line-chart__line" data-ap-daily/>
<g data-ap-notes></g>
<line class="ap-line-chart__cross" data-ap-cross/>
<rect class="ap-line-chart__dot ap-line-chart__dot--avg" width="9" height="9" rx="1.5" data-ap-dot-avg/>
<circle class="ap-line-chart__dot" r="5" data-ap-dot/>
</svg>
<div class="ap-line-chart__plot" role="slider" tabindex="0" aria-labelledby="line-chart-name" aria-describedby="line-chart-keys" aria-valuemin="1" aria-valuemax="30" aria-valuenow="1" aria-valuetext="Tuesday, 1 September" data-ap-plot>
<span class="ap-line-chart__mark" data-ap-high><span>Highest</span> <strong data-ap-num></strong></span>
<span class="ap-line-chart__mark ap-line-chart__mark--low" data-ap-low><span>Lowest</span> <strong data-ap-num></strong></span>
<span class="ap-line-chart__tip" data-ap-tip>
<span class="ap-line-chart__when" data-ap-when></span>
<span class="ap-line-chart__row"><svg class="ap-line-chart__key" viewBox="0 0 24 12" aria-hidden="true" focusable="false"><path d="M2 6h20"/></svg><strong data-ap-daily-value></strong> <span>visitors</span></span>
<span class="ap-line-chart__row"><svg class="ap-line-chart__key ap-line-chart__key--avg" viewBox="0 0 24 12" aria-hidden="true" focusable="false"><path d="M2 6h20"/></svg><strong data-ap-avg-value></strong> <span>7-day average</span></span>
<span class="ap-line-chart__flag" data-ap-flag="high" hidden>Highest of the month</span>
<span class="ap-line-chart__flag" data-ap-flag="low" hidden>Lowest of the month</span>
</span>
</div>
<div class="ap-line-chart__x" aria-hidden="true">
<span data-day="1">1 Sept</span>
<span data-day="8">8 Sept</span>
<span data-day="15">15 Sept</span>
<span data-day="22">22 Sept</span>
<span data-day="29">29 Sept</span>
</div>
</div>
<p class="ap-line-chart__keys" id="line-chart-keys">Arrow keys move a day, Page Up and Page Down a week.</p>
<p class="ap-line-chart__sr" aria-live="polite" data-ap-live></p>
<span class="ap-line-chart__sr" data-ap-say hidden>{visitors} visitors, 7-day average {average}</span>
<details class="ap-line-chart__data">
<summary class="ap-btn ap-btn--ghost ap-line-chart__toggle">
<svg class="ap-btn__icon" viewBox="0 0 24 24" aria-hidden="true" focusable="false"><rect x="3.5" y="4.5" width="17" height="15" rx="2.5"/><path d="M3.5 9.5h17M3.5 14.5h17M9.5 9.5v10"/></svg>
<span data-ap-label>Show data table</span>
</summary>
<div class="ap-line-chart__scroll" tabindex="0" role="region" aria-labelledby="line-chart-caption">
<table class="ap-line-chart__table" data-ap-table>
<caption id="line-chart-caption">Daily visitors, 1 to 30 September 2026</caption>
<thead>
<tr><th scope="col">Date</th><th scope="col">Visitors</th><th scope="col">7-day average</th></tr>
</thead>
<tbody>
<tr data-date="2026-09-01"><th scope="row"><time datetime="2026-09-01">Tue 1 Sept</time></th><td>1,610</td><td>1,430</td></tr>
<tr data-date="2026-09-02"><th scope="row"><time datetime="2026-09-02">Wed 2 Sept</time></th><td>1,630</td><td>1,440</td></tr>
<tr data-date="2026-09-03"><th scope="row"><time datetime="2026-09-03">Thu 3 Sept</time></th><td>1,620</td><td>1,470</td></tr>
<tr data-date="2026-09-04"><th scope="row"><time datetime="2026-09-04">Fri 4 Sept</time></th><td>1,650</td><td>1,490</td></tr>
<tr data-date="2026-09-05"><th scope="row"><time datetime="2026-09-05">Sat 5 Sept</time></th><td>1,350</td><td>1,500</td></tr>
<tr data-date="2026-09-06"><th scope="row"><time datetime="2026-09-06">Sun 6 Sept</time> <span class="ap-line-chart__tag">Lowest</span></th><td>1,300</td><td>1,520</td></tr>
<tr data-date="2026-09-07"><th scope="row"><time datetime="2026-09-07">Mon 7 Sept</time></th><td>1,600</td><td>1,540</td></tr>
<tr data-date="2026-09-08"><th scope="row"><time datetime="2026-09-08">Tue 8 Sept</time></th><td>1,680</td><td>1,550</td></tr>
<tr data-date="2026-09-09"><th scope="row"><time datetime="2026-09-09">Wed 9 Sept</time></th><td>1,740</td><td>1,560</td></tr>
<tr data-date="2026-09-10"><th scope="row"><time datetime="2026-09-10">Thu 10 Sept</time></th><td>1,760</td><td>1,580</td></tr>
<tr data-date="2026-09-11"><th scope="row"><time datetime="2026-09-11">Fri 11 Sept</time></th><td>1,680</td><td>1,590</td></tr>
<tr data-date="2026-09-12"><th scope="row"><time datetime="2026-09-12">Sat 12 Sept</time></th><td>1,450</td><td>1,600</td></tr>
<tr data-date="2026-09-13"><th scope="row"><time datetime="2026-09-13">Sun 13 Sept</time></th><td>1,350</td><td>1,610</td></tr>
<tr data-date="2026-09-14"><th scope="row"><time datetime="2026-09-14">Mon 14 Sept</time></th><td>1,800</td><td>1,640</td></tr>
<tr data-date="2026-09-15"><th scope="row"><time datetime="2026-09-15">Tue 15 Sept</time></th><td>1,860</td><td>1,660</td></tr>
<tr data-date="2026-09-16"><th scope="row"><time datetime="2026-09-16">Wed 16 Sept</time></th><td>1,770</td><td>1,670</td></tr>
<tr data-date="2026-09-17"><th scope="row"><time datetime="2026-09-17">Thu 17 Sept</time></th><td>1,850</td><td>1,680</td></tr>
<tr data-date="2026-09-18"><th scope="row"><time datetime="2026-09-18">Fri 18 Sept</time></th><td>1,930</td><td>1,720</td></tr>
<tr data-date="2026-09-19"><th scope="row"><time datetime="2026-09-19">Sat 19 Sept</time></th><td>1,540</td><td>1,730</td></tr>
<tr data-date="2026-09-20"><th scope="row"><time datetime="2026-09-20">Sun 20 Sept</time></th><td>1,460</td><td>1,740</td></tr>
<tr data-date="2026-09-21"><th scope="row"><time datetime="2026-09-21">Mon 21 Sept</time></th><td>1,870</td><td>1,750</td></tr>
<tr data-date="2026-09-22"><th scope="row"><time datetime="2026-09-22">Tue 22 Sept</time></th><td>1,990</td><td>1,770</td></tr>
<tr data-date="2026-09-23"><th scope="row"><time datetime="2026-09-23">Wed 23 Sept</time></th><td>2,010</td><td>1,810</td></tr>
<tr data-date="2026-09-24"><th scope="row"><time datetime="2026-09-24">Thu 24 Sept</time> <span class="ap-line-chart__tag">Highest</span></th><td>2,640</td><td>1,920</td></tr>
<tr data-date="2026-09-25"><th scope="row"><time datetime="2026-09-25">Fri 25 Sept</time></th><td>1,950</td><td>1,920</td></tr>
<tr data-date="2026-09-26"><th scope="row"><time datetime="2026-09-26">Sat 26 Sept</time></th><td>1,660</td><td>1,940</td></tr>
<tr data-date="2026-09-27"><th scope="row"><time datetime="2026-09-27">Sun 27 Sept</time></th><td>1,510</td><td>1,950</td></tr>
<tr data-date="2026-09-28"><th scope="row"><time datetime="2026-09-28">Mon 28 Sept</time></th><td>1,920</td><td>1,950</td></tr>
<tr data-date="2026-09-29"><th scope="row"><time datetime="2026-09-29">Tue 29 Sept</time></th><td>2,010</td><td>1,960</td></tr>
<tr data-date="2026-09-30"><th scope="row"><time datetime="2026-09-30">Wed 30 Sept</time></th><td>2,120</td><td>1,970</td></tr>
</tbody>
</table>
</div>
<p class="ap-line-chart__foot">The 7-day average for 1 to 6 September includes the last days of August.</p>
</details>
</figure>
/* Shared primitives: buttons and form fields used across the patterns.
   Uses the --ap-* design tokens. */

.ap-btn {
  display: inline-flex;
  align-items: center;
  justify-content: center;
  gap: 8px;
  min-height: 40px;
  padding: 0 16px;
  border: 1px solid var(--ap-border-strong);
  border-radius: var(--ap-radius-sm);
  background: var(--ap-surface);
  color: var(--ap-text);
  font: inherit;
  font-weight: 600;
  line-height: 1.2;
  text-decoration: none;
  white-space: nowrap;
  cursor: pointer;
  transition: background-color var(--ap-duration) var(--ap-ease), border-color var(--ap-duration) var(--ap-ease), box-shadow var(--ap-duration) var(--ap-ease);
}
.ap-btn:hover {
  background: var(--ap-surface-2);
}
.ap-btn:focus-visible {
  outline: 2px solid var(--ap-focus);
  outline-offset: 2px;
}
.ap-btn:disabled,
.ap-btn[aria-disabled="true"] {
  opacity: .55;
  cursor: not-allowed;
}
.ap-btn--primary {
  border-color: var(--ap-accent);
  background: var(--ap-accent);
  color: var(--ap-on-accent);
  box-shadow: var(--ap-shadow-sm);
}
.ap-btn--primary:hover {
  border-color: var(--ap-accent-hover);
  background: var(--ap-accent-hover);
}
.ap-btn--danger {
  border-color: var(--ap-danger);
  background: var(--ap-danger);
  color: var(--ap-surface);
}
.ap-btn--danger:hover {
  filter: brightness(1.08);
}
.ap-btn--ghost {
  border-color: transparent;
  background: transparent;
}
.ap-btn--ghost:hover {
  background: var(--ap-surface-2);
}
.ap-btn__icon {
  width: 18px;
  height: 18px;
  flex-shrink: 0;
  fill: none;
  stroke: currentColor;
  stroke-width: 2;
  stroke-linecap: round;
  stroke-linejoin: round;
}

.ap-field {
  display: grid;
  gap: 6px;
}
.ap-label {
  color: var(--ap-text);
  font-weight: 600;
  font-size: .9375rem;
}
.ap-hint {
  margin: 0;
  color: var(--ap-text-3);
  font-size: .875rem;
  line-height: 1.45;
}
.ap-error {
  display: flex;
  align-items: flex-start;
  gap: 6px;
  margin: 0;
  color: var(--ap-danger);
  font-size: .875rem;
  font-weight: 600;
  line-height: 1.45;
}
.ap-input {
  width: 100%;
  min-height: 44px;
  padding: 10px 12px;
  border: 1px solid var(--ap-border-strong);
  border-radius: var(--ap-radius-sm);
  background: var(--ap-surface);
  color: var(--ap-text);
  font: inherit;
  line-height: 1.4;
  transition: border-color var(--ap-duration) var(--ap-ease), box-shadow var(--ap-duration) var(--ap-ease);
}
.ap-input::placeholder {
  color: var(--ap-text-3);
}
.ap-input:hover {
  border-color: var(--ap-text-2);
}
.ap-input:focus-visible {
  outline: 2px solid var(--ap-focus);
  outline-offset: 1px;
  border-color: var(--ap-focus);
}
.ap-input[aria-invalid="true"] {
  border-color: var(--ap-danger);
  box-shadow: inset 4px 0 0 var(--ap-danger);
}
textarea.ap-input {
  resize: vertical;
  min-height: 88px;
}

@media (prefers-reduced-motion: reduce) {
  .ap-btn,
  .ap-input { transition: none; }
}

/* Line chart. Uses the --ap-* design tokens and the shared primitives. */
.ap-line-chart {
  container-type: inline-size;
  width: min(100%, 680px);
  margin: 0 auto;
  padding: 22px 24px 18px;
  border: 1px solid var(--ap-border);
  border-radius: var(--ap-radius-lg);
  background: var(--ap-surface);
  box-shadow: var(--ap-shadow-md);
  color: var(--ap-text);
}

.ap-line-chart__name {
  margin: 0;
  color: var(--ap-text);
  font-size: 1.0625rem;
  font-weight: 650;
  line-height: 1.35;
}
.ap-line-chart__takeaway {
  max-width: 58ch;
  margin: 4px 0 0;
  color: var(--ap-text-2);
  font-size: .9375rem;
  line-height: 1.5;
}

/* Line keys, not boxes: each mirrors its line, solid or dashed. */
.ap-line-chart__legend {
  display: flex;
  flex-wrap: wrap;
  gap: 6px 20px;
  margin: 14px 0 0;
  padding: 0;
  list-style: none;
  color: var(--ap-text-2);
  font-size: .8125rem;
  font-weight: 500;
}
.ap-line-chart__legend li {
  display: inline-flex;
  align-items: center;
  gap: 8px;
}
.ap-line-chart__key {
  width: 24px;
  height: 12px;
  flex-shrink: 0;
  fill: none;
  stroke: var(--ap-accent);
  stroke-width: 2.5;
  stroke-linecap: round;
}
.ap-line-chart__key--avg {
  stroke: var(--ap-text-3);
  stroke-dasharray: 5 4;
  stroke-linecap: butt;
}

/* The chart box. The script reads these lengths to lay out the SVG. */
.ap-line-chart__chart {
  --lc-gutter: 46px;
  --lc-head: 26px;
  --lc-axis: 30px;
  position: relative;
  height: 290px;
  margin-top: 12px;
}
.ap-line-chart__svg {
  position: absolute;
  inset: 0;
  width: 100%;
  height: 100%;
  overflow: visible;
  font-family: var(--ap-font);
}

.ap-line-chart__grid-line {
  stroke: var(--ap-border);
  stroke-width: 1;
  shape-rendering: crispEdges;
}
.ap-line-chart__base-line {
  stroke: var(--ap-border-strong);
}
.ap-line-chart__tick-label {
  fill: var(--ap-text-3);
  font-size: 12px;
  font-variant-numeric: tabular-nums;
  text-anchor: end;
}
.ap-line-chart__area {
  fill: var(--ap-accent);
  fill-opacity: .08;
}
.ap-line-chart__line {
  fill: none;
  stroke: var(--ap-accent);
  stroke-width: 2;
  stroke-linecap: round;
  stroke-linejoin: round;
}
.ap-line-chart__line--avg {
  stroke: var(--ap-text-3);
  stroke-dasharray: 6 5;
  stroke-linecap: butt;
}
.ap-line-chart__ring {
  fill: var(--ap-surface);
  stroke: var(--ap-accent);
  stroke-width: 2;
}

/* The crosshair and its two markers: a circle on the daily line, a square on the average. */
.ap-line-chart__cross,
.ap-line-chart__dot {
  visibility: hidden;
}
.ap-line-chart__chart.is-on .ap-line-chart__cross,
.ap-line-chart__chart.is-on .ap-line-chart__dot {
  visibility: visible;
}
.ap-line-chart__cross {
  stroke: var(--ap-text-3);
  stroke-width: 1;
  shape-rendering: crispEdges;
}
.ap-line-chart__dot {
  fill: var(--ap-accent);
  stroke: var(--ap-surface);
  stroke-width: 2;
}
.ap-line-chart__dot--avg {
  fill: var(--ap-text-3);
}

/* The slider: the plot area itself, laid over the drawing. */
.ap-line-chart__plot {
  position: absolute;
  top: 0;
  right: 0;
  bottom: var(--lc-axis);
  left: var(--lc-gutter);
  border-radius: var(--ap-radius-sm);
  cursor: crosshair;
  touch-action: pan-y;
}
.ap-line-chart__plot:focus {
  outline: none;
}
.ap-line-chart__plot:focus-visible {
  outline: 2px solid var(--ap-focus);
  outline-offset: 4px;
}

/* Highest and lowest, written on the chart. */
.ap-line-chart__mark {
  position: absolute;
  top: var(--lc-y, 0px);
  left: var(--lc-x, 0px);
  padding: 1px 6px;
  border-radius: var(--ap-radius-sm);
  background: var(--ap-surface);
  color: var(--ap-text-3);
  font-size: .75rem;
  line-height: 1.4;
  white-space: nowrap;
  transform: translate(-50%, calc(-100% - 9px));
  pointer-events: none;
}
.ap-line-chart__mark--low {
  transform: translate(-50%, 9px);
}
.ap-line-chart__mark strong {
  color: var(--ap-text);
  font-weight: 650;
  font-variant-numeric: tabular-nums;
}

/* The tooltip sits above the plot, its lower edge just inside it, so moving the
   pointer up onto it never leaves the plot. */
.ap-line-chart__tip {
  position: absolute;
  top: 6px;
  left: var(--lc-tip-x, 0px);
  z-index: 2;
  display: grid;
  gap: 3px;
  padding: 10px 12px;
  border: 1px solid var(--ap-border);
  border-radius: var(--ap-radius-sm);
  background: var(--ap-surface);
  box-shadow: var(--ap-shadow-lg);
  color: var(--ap-text);
  font-size: .8125rem;
  line-height: 1.4;
  white-space: nowrap;
  cursor: default;
  transform: translateY(-100%);
  visibility: hidden;
  opacity: 0;
  transition: opacity 120ms var(--ap-ease), visibility 0s linear 120ms;
}
.ap-line-chart__chart.is-on .ap-line-chart__tip {
  visibility: visible;
  opacity: 1;
  transition: opacity 120ms var(--ap-ease);
}
.ap-line-chart__when {
  color: var(--ap-text-3);
  font-size: .75rem;
}
.ap-line-chart__row {
  display: flex;
  align-items: center;
  gap: 8px;
  color: var(--ap-text-2);
}
.ap-line-chart__row strong {
  color: var(--ap-text);
  font-size: .9375rem;
  font-weight: 650;
  font-variant-numeric: tabular-nums;
}
.ap-line-chart__row .ap-line-chart__key {
  width: 16px;
}
.ap-line-chart__flag {
  margin-top: 2px;
  color: var(--ap-accent-text);
  font-size: .75rem;
  font-weight: 600;
}

.ap-line-chart__x {
  position: absolute;
  right: 0;
  bottom: 0;
  left: var(--lc-gutter);
  height: var(--lc-axis);
}
.ap-line-chart__x span {
  position: absolute;
  top: 8px;
  left: var(--lc-x, 0px);
  color: var(--ap-text-3);
  font-size: .75rem;
  white-space: nowrap;
  transform: translateX(-50%);
}

.ap-line-chart__keys {
  margin: 6px 0 0;
  color: var(--ap-text-3);
  font-size: .8125rem;
  line-height: 1.45;
}

.ap-line-chart__sr {
  position: absolute;
  width: 1px;
  height: 1px;
  margin: -1px;
  padding: 0;
  overflow: hidden;
  clip-path: inset(50%);
  white-space: nowrap;
}

/* The data table, in a scrolling box with a header that stays put. */
.ap-line-chart__data {
  margin-top: 14px;
  padding-top: 12px;
  border-top: 1px solid var(--ap-border);
}
.ap-line-chart__toggle {
  width: fit-content;
  margin-left: -8px;
  padding: 0 10px;
  list-style: none;
}
.ap-line-chart__toggle::-webkit-details-marker {
  display: none;
}
.ap-line-chart__scroll {
  max-height: 320px;
  margin-top: 10px;
  overflow: auto;
  border: 1px solid var(--ap-border);
  border-radius: var(--ap-radius-sm);
}
.ap-line-chart__scroll:focus-visible {
  outline: 2px solid var(--ap-focus);
  outline-offset: 2px;
}
.ap-line-chart__table {
  width: 100%;
  border-collapse: collapse;
  font-size: .875rem;
  font-variant-numeric: tabular-nums;
}
.ap-line-chart__table caption {
  padding: 10px 12px 8px;
  color: var(--ap-text-3);
  font-size: .8125rem;
  text-align: start;
}
.ap-line-chart__table th,
.ap-line-chart__table td {
  padding: 7px 12px;
  border-top: 1px solid var(--ap-border);
  text-align: end;
}
.ap-line-chart__table thead th {
  position: sticky;
  top: 0;
  z-index: 1;
  background: var(--ap-surface-2);
  color: var(--ap-text-2);
  font-weight: 600;
}
.ap-line-chart__table th:first-child {
  text-align: start;
}
.ap-line-chart__table tbody th {
  color: var(--ap-text);
  font-weight: 500;
}
.ap-line-chart__table time {
  white-space: nowrap;
}
.ap-line-chart__table td {
  color: var(--ap-text-2);
}
.ap-line-chart__tag {
  margin-left: 6px;
  padding: 1px 7px;
  border-radius: var(--ap-radius-full);
  background: var(--ap-accent-soft);
  color: var(--ap-accent-soft-text);
  font-size: .75rem;
  font-weight: 600;
}
.ap-line-chart__foot {
  margin: 8px 0 0;
  color: var(--ap-text-3);
  font-size: .8125rem;
  line-height: 1.45;
}

@container (max-width: 460px) {
  .ap-line-chart {
    padding: 18px 16px 14px;
  }
  .ap-line-chart__chart {
    --lc-gutter: 40px;
    height: 260px;
  }
  .ap-line-chart__table th,
  .ap-line-chart__table td {
    padding: 7px 8px;
  }
  .ap-line-chart__tag {
    display: inline-block;
    margin: 2px 0 0;
  }
}

@media (prefers-reduced-motion: reduce) {
  .ap-line-chart__tip { transition: none; }
}

/* Forced colors: both lines in CanvasText, told apart by the dashes and the markers. */
@media (forced-colors: active) {
  .ap-line-chart__line,
  .ap-line-chart__line--avg,
  .ap-line-chart__key,
  .ap-line-chart__key--avg { stroke: CanvasText; }
  .ap-line-chart__area { fill: none; }
  .ap-line-chart__grid-line { stroke: GrayText; }
  .ap-line-chart__base-line { stroke: CanvasText; }
  .ap-line-chart__tick-label { fill: CanvasText; }
  .ap-line-chart__ring { fill: Canvas; stroke: CanvasText; }
  .ap-line-chart__cross { stroke: Highlight; }
  .ap-line-chart__dot { fill: CanvasText; stroke: Canvas; }
  .ap-line-chart__dot--avg { fill: Canvas; stroke: CanvasText; }
}
/**
 * Line chart: an SVG line chart drawn from the table beneath it, with a
 * crosshair that the pointer or the keyboard moves along the days.
 *
 * Markup: [data-ap-line-chart] (data-max and data-step set the value axis,
 * data-region adds a region to a bare page language for dates) holding a
 * chart box [data-ap-chart] with an svg ([data-ap-grid], [data-ap-area],
 * [data-ap-daily], [data-ap-avg], [data-ap-notes], [data-ap-cross],
 * [data-ap-dot], [data-ap-dot-avg]), a role=slider plot [data-ap-plot] that
 * holds the highest and lowest labels and the tooltip, x-axis labels with
 * data-day, a polite live region [data-ap-live], a sentence template
 * [data-ap-say], and a details holding the table [data-ap-table]: one row per
 * day with its date in data-date (YYYY-MM-DD) and the two values in its cells.
 * The box's CSS lengths --lc-gutter, --lc-head and --lc-axis place the plot.
 */

const SVG = "http://www.w3.org/2000/svg";
const PAUSE = 450; // ms after the last key before the numbers are announced
const INSET = 10;  // keeps the first and last markers inside the plot

function make(tag, className, parent) {
  const el = document.createElementNS(SVG, tag);
  el.setAttribute("class", className);
  parent.append(el);
  return el;
}

const round = (n) => Math.round(n * 100) / 100;

export function init(root) {
  const chart = root.querySelector("[data-ap-chart]");
  const svg = chart.querySelector("svg");
  const part = (name) => svg.querySelector(`[data-ap-${name}]`);
  const grid = part("grid");
  const plot = chart.querySelector("[data-ap-plot]");
  const tip = plot.querySelector("[data-ap-tip]");
  const high = plot.querySelector("[data-ap-high]");
  const low = plot.querySelector("[data-ap-low]");
  const live = root.querySelector("[data-ap-live]");
  const say = root.querySelector("[data-ap-say]");
  const flags = { high: tip.querySelector("[data-ap-flag=high]"), low: tip.querySelector("[data-ap-flag=low]") };
  const details = root.querySelector("details");
  const detailsLabel = details?.querySelector("[data-ap-label]");
  const events = new AbortController();
  const on = (target, type, fn) => target.addEventListener(type, fn, { signal: events.signal });

  // The table is the data.
  const number = (text) => Number(text.replace(/[^\d.]/g, ""));
  const rows = [...root.querySelector("[data-ap-table]").tBodies[0].rows].map((tr) => {
    const [y, m, d] = tr.dataset.date.split("-").map(Number);
    return { date: new Date(y, m - 1, d), daily: number(tr.cells[1].textContent), avg: number(tr.cells[2].textContent) };
  });
  const dailies = rows.map((r) => r.daily);
  const top = dailies.indexOf(Math.max(...dailies));
  const bottom = dailies.indexOf(Math.min(...dailies));

  // Dates and numbers in the page's language, so a translated page gets its own.
  function locale() {
    const lang = root.closest("[lang]")?.lang || navigator.language;
    const region = root.dataset.region;
    return region && !lang.includes("-") ? `${lang}-${region}` : lang;
  }
  function format(options, date) {
    try {
      return new Intl.DateTimeFormat(locale(), options).format(date);
    } catch {
      return new Intl.DateTimeFormat(undefined, options).format(date);
    }
  }
  const count = (n) => {
    try {
      return new Intl.NumberFormat(locale()).format(n);
    } catch {
      return String(n);
    }
  };

  let value = Math.max(0, Number(plot.getAttribute("aria-valuenow")) - 1);
  let hover = -1;
  let focused = false;
  let dismissed = false;
  let timer = 0;
  let x = () => 0;
  let y = () => 0;
  let gutter = 0;

  function draw() {
    const width = chart.clientWidth;
    const height = chart.clientHeight;
    if (!width || !height) return;
    const css = getComputedStyle(chart);
    gutter = parseFloat(css.getPropertyValue("--lc-gutter")) || 46;
    const head = parseFloat(css.getPropertyValue("--lc-head")) || 26;
    const axis = parseFloat(css.getPropertyValue("--lc-axis")) || 30;
    const max = Number(root.dataset.max) || Math.max(...dailies);
    const step = Number(root.dataset.step) || max / 5;
    const base = height - axis;
    const last = rows.length - 1;
    x = (i) => gutter + INSET + ((width - gutter - 2 * INSET) * i) / last;
    y = (v) => base - (v / max) * (base - head);

    grid.replaceChildren();
    for (let v = 0; v <= max + 1e-9; v += step) {
      const at = round(y(v)) + 0.5;
      const line = make("line", v === 0 ? "ap-line-chart__grid-line ap-line-chart__base-line" : "ap-line-chart__grid-line", grid);
      line.setAttribute("x1", gutter);
      line.setAttribute("x2", width);
      line.setAttribute("y1", at);
      line.setAttribute("y2", at);
      const label = make("text", "ap-line-chart__tick-label", grid);
      label.setAttribute("x", gutter - 10);
      label.setAttribute("y", at);
      label.setAttribute("dy", "0.35em");
      label.textContent = count(v);
    }

    const path = (key) => rows.map((r, i) => `${i ? "L" : "M"}${round(x(i))} ${round(y(r[key]))}`).join("");
    const daily = path("daily");
    part("daily").setAttribute("d", daily);
    part("avg").setAttribute("d", path("avg"));
    part("area").setAttribute("d", `${daily}L${round(x(last))} ${base}L${round(x(0))} ${base}Z`);

    // Hollow rings on the highest and lowest days, labelled in HTML beside them.
    const notes = part("notes");
    notes.replaceChildren();
    for (const [i, label] of [[top, high], [bottom, low]]) {
      const ring = make("circle", "ap-line-chart__ring", notes);
      ring.setAttribute("cx", round(x(i)));
      ring.setAttribute("cy", round(y(dailies[i])));
      ring.setAttribute("r", 4.5);
      label.querySelector("[data-ap-num]").textContent = count(dailies[i]);
      const half = label.offsetWidth / 2;
      const left = Math.min(Math.max(x(i) - gutter, half), width - gutter - half);
      label.style.setProperty("--lc-x", `${round(left)}px`);
      label.style.setProperty("--lc-y", `${round(y(dailies[i]))}px`);
    }

    for (const tick of chart.querySelectorAll("[data-day]")) {
      tick.style.setProperty("--lc-x", `${round(x(Number(tick.dataset.day) - 1) - gutter)}px`);
    }
    paint();
  }

  /* ── The crosshair: the hovered day, else the slider's day while it has focus ── */
  function paint() {
    const at = hover >= 0 ? hover : focused ? value : -1;
    const shown = at >= 0 && !dismissed;
    chart.classList.toggle("is-on", shown);
    if (!shown) return;
    const r = rows[at];
    const cx = round(x(at));
    const cross = part("cross");
    cross.setAttribute("x1", cx);
    cross.setAttribute("x2", cx);
    cross.setAttribute("y1", 0);
    cross.setAttribute("y2", round(y(0)));
    part("dot").setAttribute("cx", cx);
    part("dot").setAttribute("cy", round(y(r.daily)));
    part("dot-avg").setAttribute("x", round(cx - 4.5));
    part("dot-avg").setAttribute("y", round(y(r.avg) - 4.5));

    tip.querySelector("[data-ap-when]").textContent = format({ weekday: "short", day: "numeric", month: "short" }, r.date);
    tip.querySelector("[data-ap-daily-value]").textContent = count(r.daily);
    tip.querySelector("[data-ap-avg-value]").textContent = count(r.avg);
    flags.high.hidden = at !== top;
    flags.low.hidden = at !== bottom;
    // Above the plot, over the crosshair: the pointer reaches it by moving straight
    // up, which keeps the same day, and it never covers the lines.
    const w = tip.offsetWidth;
    const left = Math.min(Math.max(cx - gutter - w / 2, -gutter), plot.clientWidth - w);
    tip.style.setProperty("--lc-tip-x", `${round(left)}px`);
  }

  function sentence(i) {
    const r = rows[i];
    let text = say.textContent.replace("{visitors}", count(r.daily)).replace("{average}", count(r.avg));
    if (i === top) text += `. ${flags.high.textContent}`;
    if (i === bottom) text += `. ${flags.low.textContent}`;
    return text;
  }

  // The numbers wait until the keys stop, so holding an arrow down is one announcement.
  function announce() {
    clearTimeout(timer);
    timer = setTimeout(() => {
      live.textContent = "";
      requestAnimationFrame(() => { live.textContent = sentence(value); });
    }, PAUSE);
  }

  function setValue(i, { speak = true } = {}) {
    value = Math.min(Math.max(i, 0), rows.length - 1);
    plot.setAttribute("aria-valuenow", String(value + 1));
    plot.setAttribute("aria-valuetext", format({ weekday: "long", day: "numeric", month: "long" }, rows[value].date));
    hover = -1;
    dismissed = false;
    paint();
    if (speak) announce();
  }

  const nearest = (clientX) => {
    const left = chart.getBoundingClientRect().left;
    let best = 0;
    for (let i = 1; i < rows.length; i++) {
      if (Math.abs(x(i) + left - clientX) < Math.abs(x(best) + left - clientX)) best = i;
    }
    return best;
  };

  on(plot, "keydown", (event) => {
    const steps = { ArrowRight: 1, ArrowUp: 1, ArrowLeft: -1, ArrowDown: -1, PageUp: 7, PageDown: -7 };
    if (event.key in steps) setValue(value + steps[event.key]);
    else if (event.key === "Home") setValue(0);
    else if (event.key === "End") setValue(rows.length - 1);
    else if (event.key === "Escape" && chart.classList.contains("is-on")) {
      // Hide the crosshair and tooltip; focus stays on the chart.
      event.stopPropagation();
      dismissed = true;
      paint();
    } else return;
    event.preventDefault();
  });

  on(plot, "focus", () => {
    focused = true;
    dismissed = false;
    paint();
    announce();
  });
  on(plot, "blur", () => {
    focused = false;
    clearTimeout(timer);
    paint();
  });

  on(plot, "pointerdown", (event) => {
    if (tip.contains(event.target)) return;
    setValue(nearest(event.clientX));
  });
  on(plot, "pointermove", (event) => {
    // Over the tooltip, the crosshair holds still so the tooltip can be read.
    if (tip.contains(event.target)) return;
    const i = nearest(event.clientX);
    // A finger or pen dragging along the plot moves the slider itself.
    if (event.pointerType !== "mouse" && event.buttons) {
      if (i !== value) setValue(i);
      return;
    }
    if (i !== hover) {
      hover = i;
      dismissed = false;
      paint();
    }
  });
  on(plot, "pointerleave", () => {
    hover = -1;
    paint();
  });
  // Escape also hides a tooltip shown by hovering while focus is elsewhere.
  on(document, "keydown", (event) => {
    if (event.key === "Escape" && document.activeElement !== plot && chart.classList.contains("is-on")) {
      dismissed = true;
      paint();
    }
  });

  if (details && detailsLabel) {
    on(details, "toggle", () => {
      detailsLabel.textContent = details.open ? "Hide data table" : "Show data table";
    });
  }

  // A page that switches language mid-visit gets its dates and numbers redone.
  const language = new MutationObserver(() => {
    setValue(value, { speak: false });
    draw();
  });
  language.observe(document.documentElement, { attributes: true, attributeFilter: ["lang"] });

  const resize = new ResizeObserver(draw);
  resize.observe(chart);
  setValue(value, { speak: false });
  draw();

  return () => {
    events.abort();
    resize.disconnect();
    language.disconnect();
    clearTimeout(timer);
  };
}

for (const root of document.querySelectorAll("[data-ap-line-chart]")) init(root);
/* Design tokens for the pattern components. Light by default, dark when the
   system asks for it; set data-theme="dark" on :root to force dark. */
:root {
    --ap-radius-sm: 8px;
    --ap-radius: 12px;
    --ap-radius-lg: 16px;
    --ap-radius-full: 999px;
    --ap-font: "Instrument Sans", ui-sans-serif, system-ui, -apple-system, "Segoe UI", Roboto, sans-serif;
    --ap-mono: "JetBrains Mono", ui-monospace, "Cascadia Mono", "SF Mono", Consolas, monospace;
    --ap-ease: cubic-bezier(.2, .8, .2, 1);
    --ap-duration: 180ms;
    --ap-target: 44px;
    --ap-bg: #F4F4F5;
    --ap-surface: #FFFFFF;
    --ap-surface-2: #F4F4F5;
    --ap-surface-3: #E4E4E7;
    --ap-border: #E4E4E7;
    --ap-border-strong: #76767F;
    --ap-text: #18181B;
    --ap-text-2: #3F3F46;
    --ap-text-3: #5E5E66;
    --ap-accent: #4F46E5;
    --ap-accent-hover: #4338CA;
    --ap-on-accent: #FFFFFF;
    --ap-accent-text: #4338CA;
    --ap-accent-soft: #EEF2FF;
    --ap-accent-soft-text: #3730A3;
    --ap-focus: #4F46E5;
    --ap-danger: #B91C1C;
    --ap-danger-soft: #FEF2F2;
    --ap-success: #15803D;
    --ap-success-soft: #F0FDF4;
    --ap-warning: #A15C07;
    --ap-warning-soft: #FEFCE8;
    --ap-info: #1D4ED8;
    --ap-info-soft: #EFF6FF;
    --ap-scrim: rgb(9 9 11 / .48);
    --ap-shadow-sm: 0 1px 2px rgb(9 9 11 / .06);
    --ap-shadow-md: 0 1px 2px rgb(9 9 11 / .05), 0 6px 16px -4px rgb(9 9 11 / .1);
    --ap-shadow-lg: 0 2px 6px rgb(9 9 11 / .06), 0 20px 40px -12px rgb(9 9 11 / .22);
    --ap-light-bg: #F4F4F5;
    --ap-light-surface: #FFFFFF;
    --ap-light-surface-2: #F4F4F5;
    --ap-light-surface-3: #E4E4E7;
    --ap-light-border: #E4E4E7;
    --ap-light-border-strong: #76767F;
    --ap-light-text: #18181B;
    --ap-light-text-2: #3F3F46;
    --ap-light-text-3: #5E5E66;
    --ap-light-accent: #4F46E5;
    --ap-light-accent-hover: #4338CA;
    --ap-light-on-accent: #FFFFFF;
    --ap-light-accent-text: #4338CA;
    --ap-light-accent-soft: #EEF2FF;
    --ap-light-accent-soft-text: #3730A3;
    --ap-light-focus: #4F46E5;
    --ap-light-danger: #B91C1C;
    --ap-light-danger-soft: #FEF2F2;
    --ap-light-success: #15803D;
    --ap-light-success-soft: #F0FDF4;
    --ap-light-warning: #A15C07;
    --ap-light-warning-soft: #FEFCE8;
    --ap-light-info: #1D4ED8;
    --ap-light-info-soft: #EFF6FF;
    --ap-light-scrim: rgb(9 9 11 / .48);
    --ap-light-shadow-sm: 0 1px 2px rgb(9 9 11 / .06);
    --ap-light-shadow-md: 0 1px 2px rgb(9 9 11 / .05), 0 6px 16px -4px rgb(9 9 11 / .1);
    --ap-light-shadow-lg: 0 2px 6px rgb(9 9 11 / .06), 0 20px 40px -12px rgb(9 9 11 / .22);
    --ap-dark-bg: #09090B;
    --ap-dark-surface: #18181B;
    --ap-dark-surface-2: #27272A;
    --ap-dark-surface-3: #3F3F46;
    --ap-dark-border: #2E2E33;
    --ap-dark-border-strong: #8E8E97;
    --ap-dark-text: #FAFAFA;
    --ap-dark-text-2: #D4D4D8;
    --ap-dark-text-3: #A1A1AA;
    --ap-dark-accent: #818CF8;
    --ap-dark-accent-hover: #A5B4FC;
    --ap-dark-on-accent: #0C0A1F;
    --ap-dark-accent-text: #A5B4FC;
    --ap-dark-accent-soft: #1E1B4B;
    --ap-dark-accent-soft-text: #C7D2FE;
    --ap-dark-focus: #A5B4FC;
    --ap-dark-danger: #F87171;
    --ap-dark-danger-soft: #2A1215;
    --ap-dark-success: #4ADE80;
    --ap-dark-success-soft: #0F2A1A;
    --ap-dark-warning: #FACC15;
    --ap-dark-warning-soft: #2A2410;
    --ap-dark-info: #60A5FA;
    --ap-dark-info-soft: #0F1D33;
    --ap-dark-scrim: rgb(0 0 0 / .62);
    --ap-dark-shadow-sm: 0 1px 2px rgb(0 0 0 / .4);
    --ap-dark-shadow-md: 0 1px 2px rgb(0 0 0 / .4), 0 8px 20px -6px rgb(0 0 0 / .5);
    --ap-dark-shadow-lg: 0 2px 8px rgb(0 0 0 / .45), 0 24px 48px -12px rgb(0 0 0 / .7);
}
@media (prefers-color-scheme: dark) {
  :root:not([data-theme="light"]) {
      --ap-bg: #09090B;
      --ap-surface: #18181B;
      --ap-surface-2: #27272A;
      --ap-surface-3: #3F3F46;
      --ap-border: #2E2E33;
      --ap-border-strong: #8E8E97;
      --ap-text: #FAFAFA;
      --ap-text-2: #D4D4D8;
      --ap-text-3: #A1A1AA;
      --ap-accent: #818CF8;
      --ap-accent-hover: #A5B4FC;
      --ap-on-accent: #0C0A1F;
      --ap-accent-text: #A5B4FC;
      --ap-accent-soft: #1E1B4B;
      --ap-accent-soft-text: #C7D2FE;
      --ap-focus: #A5B4FC;
      --ap-danger: #F87171;
      --ap-danger-soft: #2A1215;
      --ap-success: #4ADE80;
      --ap-success-soft: #0F2A1A;
      --ap-warning: #FACC15;
      --ap-warning-soft: #2A2410;
      --ap-info: #60A5FA;
      --ap-info-soft: #0F1D33;
      --ap-scrim: rgb(0 0 0 / .62);
      --ap-shadow-sm: 0 1px 2px rgb(0 0 0 / .4);
      --ap-shadow-md: 0 1px 2px rgb(0 0 0 / .4), 0 8px 20px -6px rgb(0 0 0 / .5);
      --ap-shadow-lg: 0 2px 8px rgb(0 0 0 / .45), 0 24px 48px -12px rgb(0 0 0 / .7);
  }
}
:root[data-theme="dark"] {
    --ap-bg: #09090B;
    --ap-surface: #18181B;
    --ap-surface-2: #27272A;
    --ap-surface-3: #3F3F46;
    --ap-border: #2E2E33;
    --ap-border-strong: #8E8E97;
    --ap-text: #FAFAFA;
    --ap-text-2: #D4D4D8;
    --ap-text-3: #A1A1AA;
    --ap-accent: #818CF8;
    --ap-accent-hover: #A5B4FC;
    --ap-on-accent: #0C0A1F;
    --ap-accent-text: #A5B4FC;
    --ap-accent-soft: #1E1B4B;
    --ap-accent-soft-text: #C7D2FE;
    --ap-focus: #A5B4FC;
    --ap-danger: #F87171;
    --ap-danger-soft: #2A1215;
    --ap-success: #4ADE80;
    --ap-success-soft: #0F2A1A;
    --ap-warning: #FACC15;
    --ap-warning-soft: #2A2410;
    --ap-info: #60A5FA;
    --ap-info-soft: #0F1D33;
    --ap-scrim: rgb(0 0 0 / .62);
    --ap-shadow-sm: 0 1px 2px rgb(0 0 0 / .4);
    --ap-shadow-md: 0 1px 2px rgb(0 0 0 / .4), 0 8px 20px -6px rgb(0 0 0 / .5);
    --ap-shadow-lg: 0 2px 8px rgb(0 0 0 / .45), 0 24px 48px -12px rgb(0 0 0 / .7);
}
WCAG 2.2
What it meets
The success criteria this pattern takes care of, and how.
-
1.1.1 Non-text Content
Level A
The chart is named by its heading and summed up by a visible takeaway; every day's numbers can be read with the crosshair or in the table.
-
1.3.1 Info and Relationships
Level A
The data is a real table with a caption and headers, and the drawing is generated from it, so the two cannot disagree.
-
1.4.1 Use of Color
Level A
The 7-day average is dashed as well as a different color, and the legend says so in words.
-
1.4.11 Non-text Contrast
Level AA
Both lines and their markers clear 3:1 against the surface in both themes, and under forced colors they are redrawn in CanvasText.
-
1.4.13 Content on Hover or Focus
Level AA
The tooltip can be hovered without moving, stays until the pointer or focus leaves the plot, and Escape hides it.
-
2.1.1 Keyboard
Level A
Every day can be reached with the arrow keys, Page Up and Page Down, Home and End, the keys people expect from a slider.
-
4.1.3 Status Messages
Level AA
Each day's numbers are announced through a polite live region, once the keys pause, without moving focus.
Usage
When to use it
Use it
- Change over time with many points, like daily visitors, temperatures or prices over a month.
- Comparing a raw series with its trend, or two measures that share one unit and one axis.
Use something else
- Two measures with different units: draw two charts rather than a second axis.
- A few categories with no order in time: use a bar chart.
- A single latest value that matters more than the history: show the number, with the line as a small sparkline.
Common failures
How it usually goes wrong
Thirty tab stops
Making every point focusable puts thirty stops between the chart and the rest of the page. One focusable plot with arrow keys inside it is faster for everyone.
A live region that floods
Announcing every point as the key repeats queues a minute of speech. The date comes from the slider at once and the numbers only after the keys pause.
A second axis
Two y-axes invite comparisons the data does not support, and a screen reader user cannot see which line belongs to which. Both series here share one axis and one unit.
Series told apart by hue
Two lines in similar colors merge for many people and disappear in forced colors. The average is dashed and named in the legend, and the lines turn CanvasText in forced colors.
Peaks you have to find yourself
The highest and lowest days are the story; leaving people to hunt for them by hovering hides it. They are labelled on the chart, flagged in the table and stated in the takeaway.
A tooltip that runs away
A tooltip beside a moving crosshair slides off as the pointer heads for it, and one over the point hides the line. This one sits above the plot over the crosshair: moving straight up keeps the same day, and Escape hides it.
Notes
Building it
- role=slider is deliberate: it makes screen readers pass the arrow keys through, and Home, End, Page Up and Page Down are the keys a slider already promises. The value is the date, so it is short to hear.
- The live region is written 450 milliseconds after the last key, so holding an arrow down gives one announcement when you stop, not one per day.
- The script reads the table, draws the SVG at the chart's real size and redraws when it resizes, so lines stay two pixels wide and markers stay round.
- Dates are formatted with Intl.DateTimeFormat in the page's language, and the sentence it announces is a template in the markup, so a translation can reorder its words.
- The area under the daily line is a light wash of the series color; under forced colors it is removed and both lines become CanvasText.
Sources: WAI-ARIA Authoring Practices: Slider · WAI Images Tutorial: Complex images
Checked with axe in light and dark themes, at desktop and phone widths, and by keyboard. Not yet tested with every screen reader and browser pair. Report a correction
Related
Patterns that go with it
-
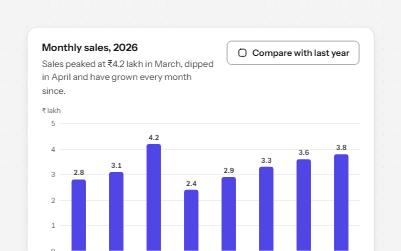
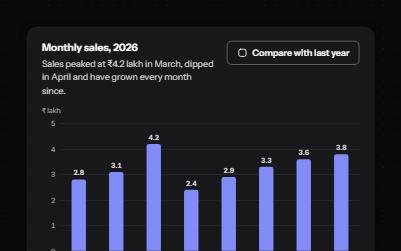
Accessible bar chart
A column chart people can read without seeing it: named bars on one tab stop, a tooltip that stays put, and a table.
-
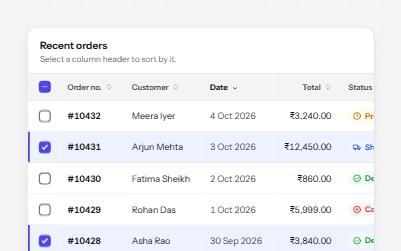
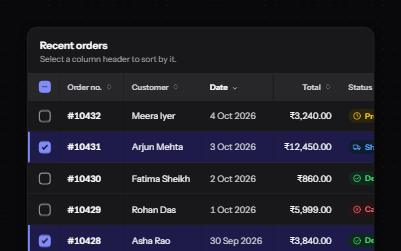
Sortable table
A data table with a caption, row headers, sort buttons that report the order, and row selection with a mixed Select all.
-
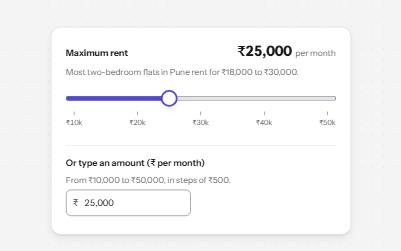
Slider
A native range input styled with a filled track and a large thumb, its value said with units, and a number field kept in step.
-
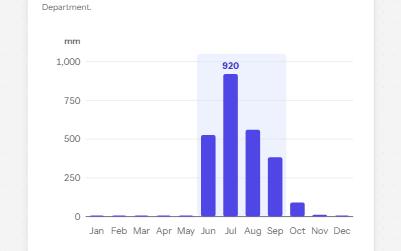
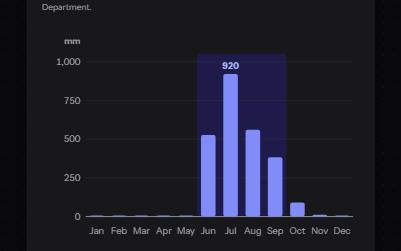
Complex image
A chart with a short alt that gives its point, a long description in a disclosure, and its data in a table beside it.